Unlock a world of possibilities! Login now and discover the exclusive benefits awaiting you.
- Qlik Community
- :
- All Forums
- :
- QlikView App Dev
- :
- line chart accumulation to ignore dimension select...
- Subscribe to RSS Feed
- Mark Topic as New
- Mark Topic as Read
- Float this Topic for Current User
- Bookmark
- Subscribe
- Mute
- Printer Friendly Page
- Mark as New
- Bookmark
- Subscribe
- Mute
- Subscribe to RSS Feed
- Permalink
- Report Inappropriate Content
line chart accumulation to ignore dimension selection
Hello,
I'm new to qlikview and I need some help regarding my chart.
Right now I have a combo chart with bars and a line, which is accumulation of bar values.
However the accumulation value changes whenever I select different dates.
Would it be possible to make the accumulation value stays the same regardless of my date selection?
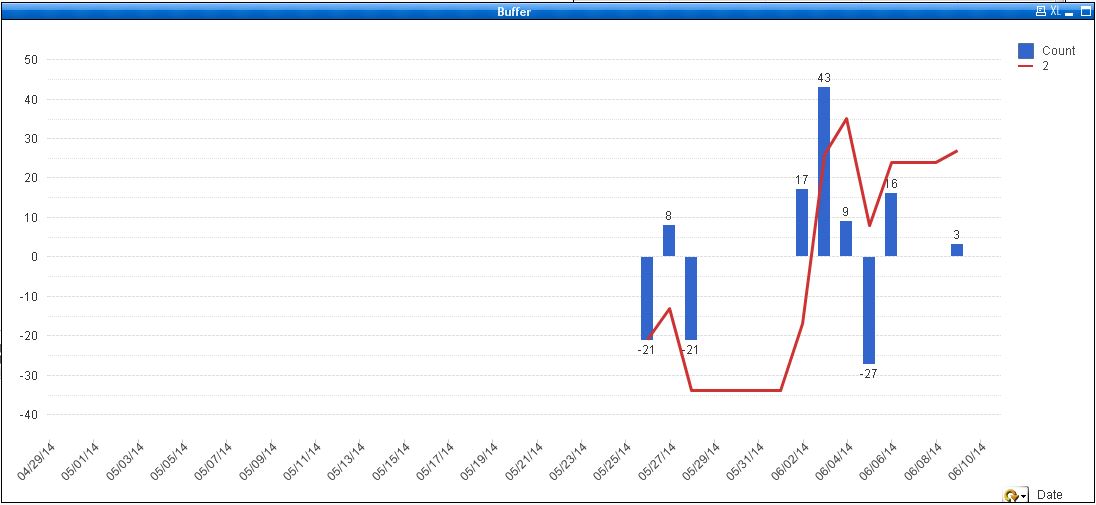
Here on 5/27/14 the red line value is -13.
I used this expression : RangeSum( above (Count(if(Stage='1' and Date>=Date#('05-26-14', 'MM-DD-YY'),1)) - Count(if(Stage='2' and Date>=Date#('05-26-14', 'MM-DD-YY'),1)), 0, RowNo()))
If I select 5/27~5/28 the red line value changes to 8. It doesn't include the previous value.
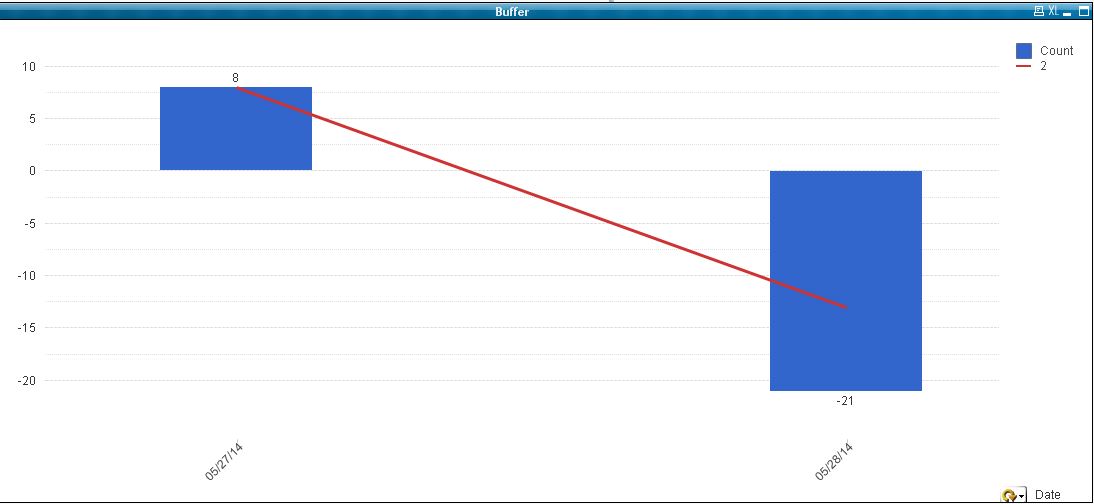
I want to make the red line value to stay as -13 even if I select different dates. Is it even possible? Any suggestions?
Thank you.
- Mark as New
- Bookmark
- Subscribe
- Mute
- Subscribe to RSS Feed
- Permalink
- Report Inappropriate Content
Hi Song,
DId you try using Set Analysis?
RangeSum( {<Date=>} above (Count(if(Stage='1' and Date>=Date#('05-26-14', 'MM-DD-YY'),1)) - Count(if(Stage='2' and Date>=Date#('05-26-14', 'MM-DD-YY'),1)), 0, RowNo()))
I might have errors in the syntax though,
Hope it helps,
Antoine
- Mark as New
- Bookmark
- Subscribe
- Mute
- Subscribe to RSS Feed
- Permalink
- Report Inappropriate Content
Thanks for your reply!
I tried
RangeSum(above (Count({<date=>} if(Stage='1' and Date>=Date#('05-26-14', 'MM-DD-YY'),1)) - Count({<date=>} if(Stage='2' and Date>=Date#('05-26-14', 'MM-DD-YY'),1)), 0, RowNo()))
and it doesn't work on my current dimension, TimeCycle.
But it sometimes works if I use Date as the dimension.
However if I choose Date dimension, the accumulation begins at 27..
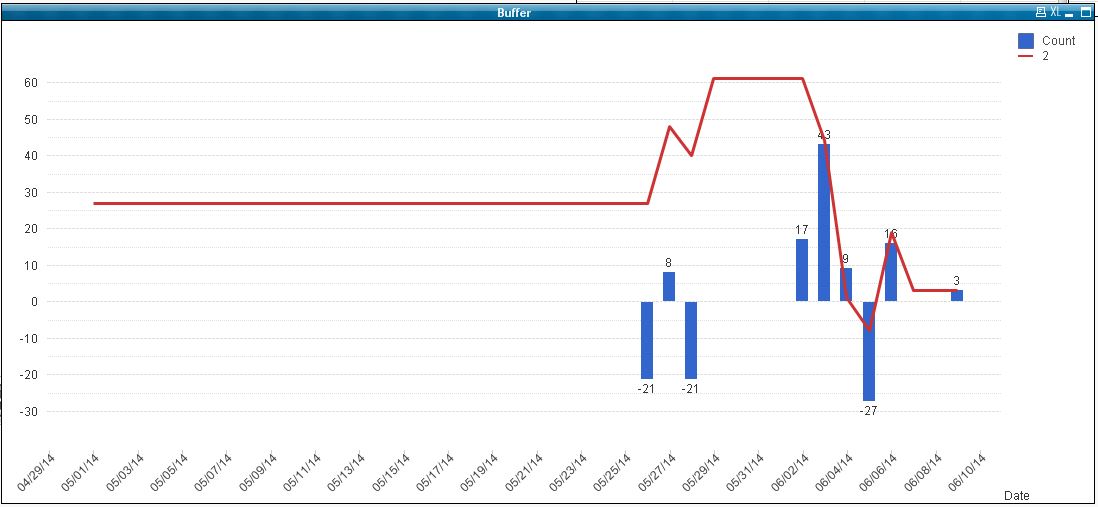
Does anyone know why?
Thanks in advance.