Unlock a world of possibilities! Login now and discover the exclusive benefits awaiting you.
- Qlik Community
- :
- All Forums
- :
- QlikView App Dev
- :
- line chart display %
- Subscribe to RSS Feed
- Mark Topic as New
- Mark Topic as Read
- Float this Topic for Current User
- Bookmark
- Subscribe
- Mute
- Printer Friendly Page
- Mark as New
- Bookmark
- Subscribe
- Mute
- Subscribe to RSS Feed
- Permalink
- Report Inappropriate Content
line chart display %
Hi Experts,
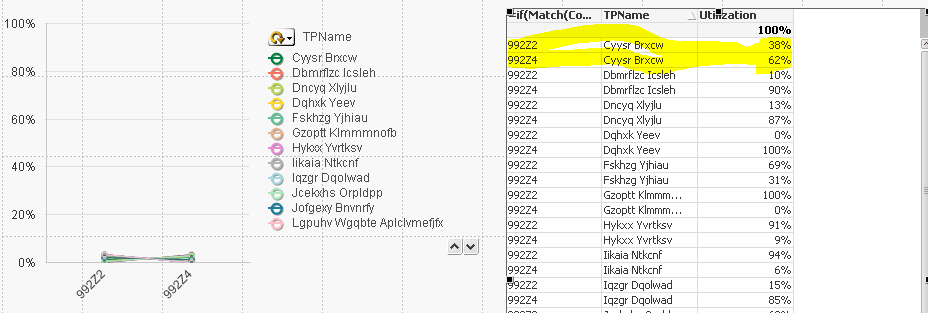
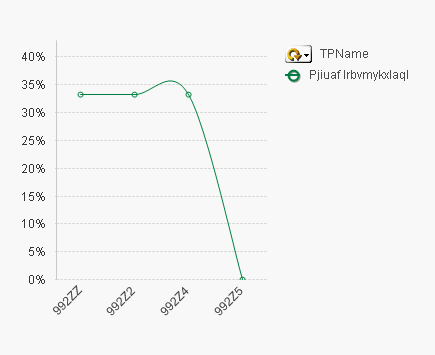
I need to display a static 100% on this graph. Even whennothing is selected from TPName, the lines should display the utlization for that TPName. E.g. for the below TPName, the graph shoud display at 33% for all codes even if I do not select the TPName.
| Code | TPName | Utilization |
| 100% | ||
| 992ZZ | Pjiuaf Irbvmykxlaql | 33% |
| 992Z2 | Pjiuaf Irbvmykxlaql | 33% |
| 992Z4 | Pjiuaf Irbvmykxlaql | 33% |
| 992Z5 | Pjiuaf Irbvmykxlaql | 0% |
When that specific TPName is selected
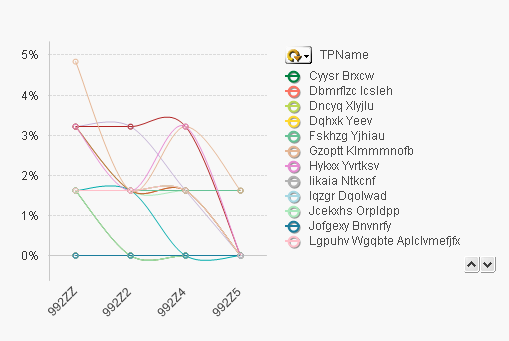
When nothing is selected the graph resizes to 5 %
Please help!
Accepted Solutions
- Mark as New
- Bookmark
- Subscribe
- Mute
- Subscribe to RSS Feed
- Permalink
- Report Inappropriate Content
May be this?
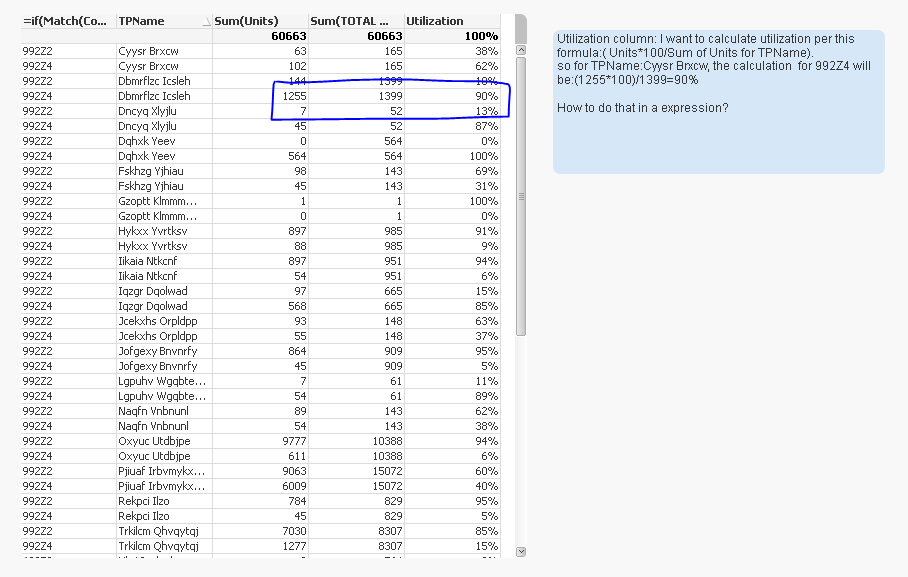
sum(Units)/Sum(TOTAL <TPName> {<Code={'992Z2','992Z4'}>}Units)
- Mark as New
- Bookmark
- Subscribe
- Mute
- Subscribe to RSS Feed
- Permalink
- Report Inappropriate Content
Not sure what your expression is, but assuming it is Count(Measure), you can try like this
Count(Measure)/Count(TOTAL <TPName> Measure)
and make sure that relative is unchecked on the expressions tab for this expression.
- Mark as New
- Bookmark
- Subscribe
- Mute
- Subscribe to RSS Feed
- Permalink
- Report Inappropriate Content
Have you check Static Min,Static Max values in the Axes tab?
How can the Chart scale DOWN to 5% when one of your dimension values is upto 33%
If a post helps to resolve your issue, please accept it as a Solution.
- Mark as New
- Bookmark
- Subscribe
- Mute
- Subscribe to RSS Feed
- Permalink
- Report Inappropriate Content
Thanks Sunny and Vineet. Here is the sample QVW.
- Mark as New
- Bookmark
- Subscribe
- Mute
- Subscribe to RSS Feed
- Permalink
- Report Inappropriate Content
Please see this sample QVW
- Mark as New
- Bookmark
- Subscribe
- Mute
- Subscribe to RSS Feed
- Permalink
- Report Inappropriate Content
May be this?
sum(Units)/Sum(TOTAL <TPName> {<Code={'992Z2','992Z4'}>}Units)
- Mark as New
- Bookmark
- Subscribe
- Mute
- Subscribe to RSS Feed
- Permalink
- Report Inappropriate Content
Thanks Sunny. This works in the chart, but this does not display in the graph,.I want the graph to display 38%, 62% curve for this TPName all the time, not just when I select this TPName.