Unlock a world of possibilities! Login now and discover the exclusive benefits awaiting you.
- Qlik Community
- :
- All Forums
- :
- QlikView App Dev
- :
- line chart values on data point 1 below line other...
- Subscribe to RSS Feed
- Mark Topic as New
- Mark Topic as Read
- Float this Topic for Current User
- Bookmark
- Subscribe
- Mute
- Printer Friendly Page
- Mark as New
- Bookmark
- Subscribe
- Mute
- Subscribe to RSS Feed
- Permalink
- Report Inappropriate Content
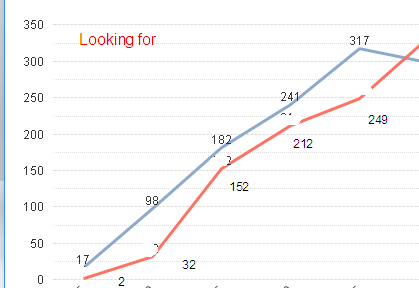
line chart values on data point 1 below line other above line
I have a line chart with 2 line.
Is it possible that the values of line 1 will be displayed above the line and that the values of the second line will be displayed below the line.
See screenshots
- Tags:
- new_to_qlikview
- Mark as New
- Bookmark
- Subscribe
- Mute
- Subscribe to RSS Feed
- Permalink
- Report Inappropriate Content
You can add another text representation to your values and QV will use it for value labels.
The problem is you can only displace value to the left or to ther right.
Try this kind of expressions:
=dual(Value1 & ' ', Value1) or =dual(Value1 & chr(1) & chr(1) & chr(1), Value1)
=dual(' ' & Value2, Value2)
' ' << It's NOT SPACES. QV trims spaces. Use some other invisible symbol. I used chr(1).
To just type such symbols press Alt then type number on additional numeric keyboard then release Alt.
- Mark as New
- Bookmark
- Subscribe
- Mute
- Subscribe to RSS Feed
- Permalink
- Report Inappropriate Content
Hi,
Thanks again for you help !
I need it in the line chart which helped me so perfect earlier this week.
Problem, how can I use your formulas when I have only 1 Expression =sum(Medewerker.Headcount)
- Mark as New
- Bookmark
- Subscribe
- Mute
- Subscribe to RSS Feed
- Permalink
- Report Inappropriate Content
You can try to distinguish your dimension values with rowno() function like this:
=if(RowNo()=1,
dual(chr(1) & chr(1) & chr(1) & Value, Value),
dual(Value & chr(1) & chr(1) & chr(1), Value))
or directly
=if(YourDimension='YourDimensionValue1',
dual(chr(1) & chr(1) & chr(1) & Value, Value),
dual(Value & chr(1) & chr(1) & chr(1), Value))