Unlock a world of possibilities! Login now and discover the exclusive benefits awaiting you.
- Qlik Community
- :
- All Forums
- :
- QlikView App Dev
- :
- Re: line level count and avg at total is it possib...
- Subscribe to RSS Feed
- Mark Topic as New
- Mark Topic as Read
- Float this Topic for Current User
- Bookmark
- Subscribe
- Mute
- Printer Friendly Page
- Mark as New
- Bookmark
- Subscribe
- Mute
- Subscribe to RSS Feed
- Permalink
- Report Inappropriate Content
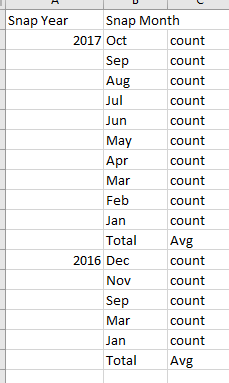
line level count and avg at total is it possible?
Hi All
is it possible to count by month and Total would be Average?
- « Previous Replies
-
- 1
- 2
- Next Replies »
Accepted Solutions
- Mark as New
- Bookmark
- Subscribe
- Mute
- Subscribe to RSS Feed
- Permalink
- Report Inappropriate Content
This?
Sum({<Period=,Period={'<=$(=max(Period))'}>}aggr(sum({<Period=,Period={'<=$(=max(Period))'}>}data),Yr, mnth))/Count({<Period=,Period={'<=$(=max(Period))'}>}DISTINCT Yr)
- Mark as New
- Bookmark
- Subscribe
- Mute
- Subscribe to RSS Feed
- Permalink
- Report Inappropriate Content
Sure... it would be something like this may be
Avg(Aggr(Count(Measure), SnapYear, SnapMonth))
- Mark as New
- Bookmark
- Subscribe
- Mute
- Subscribe to RSS Feed
- Permalink
- Report Inappropriate Content
It didnt work
AVG(aggr(Count( {<[Year/Month],Period={'<=$(=max(Period))'}>} EMPLID),YEAR,MONTH))
with this I got was only Oct (As user has selected Oct) no other months showed
2017 10 122878
I dont know what that 122878 number is..not the AVG...I have all values below 80000
- Mark as New
- Bookmark
- Subscribe
- Mute
- Subscribe to RSS Feed
- Permalink
- Report Inappropriate Content
Can you share a sample app to look into?
- Mark as New
- Bookmark
- Subscribe
- Mute
- Subscribe to RSS Feed
- Permalink
- Report Inappropriate Content
First of all, let me ask you this... did it not work at all, or did it not work as your expected? The reason it did not work as expected it because you failed to provide complete information.... do you expect me to know your expression and give you a result that would work for you? I am sorry, but you will have a hard time all the time...
Anyways, try adding the set analysis from your inner aggregation to the outer one and see if this resolves your problem.
Avg({<[Year/Month],Period={'<=$(=max(Period))'}>}Aggr(Count( {<[Year/Month],Period={'<=$(=max(Period))'}>} EMPLID),YEAR,MONTH))
- Mark as New
- Bookmark
- Subscribe
- Mute
- Subscribe to RSS Feed
- Permalink
- Report Inappropriate Content
Sunny, Thanks for help. Much appreciated.
Still AGGR() and AVG() producing some results difficult to figure out what they are doing. I have to dig more on these functions. I feel in QV these 2 functions are not straight forward.
- Mark as New
- Bookmark
- Subscribe
- Mute
- Subscribe to RSS Feed
- Permalink
- Report Inappropriate Content
So the value for the row level isn't the right number? or just the totals are off?
- Mark as New
- Bookmark
- Subscribe
- Mute
- Subscribe to RSS Feed
- Permalink
- Report Inappropriate Content
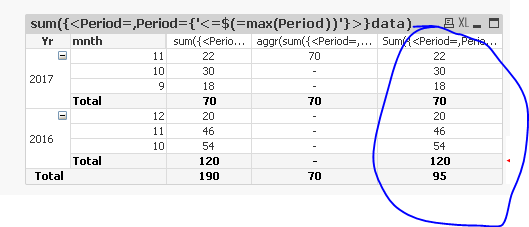
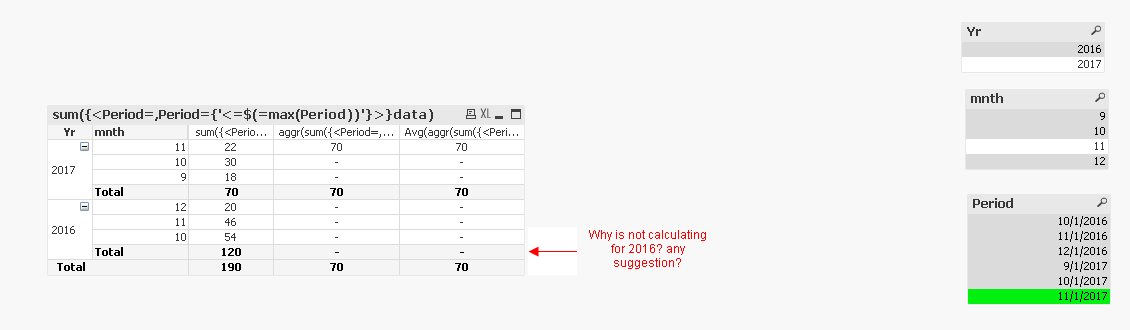
Attached is an app I was able to reproduce problem in sample data. Any suggestions why it is not calculating roll up for 2016 and work around?
Thanks
- Mark as New
- Bookmark
- Subscribe
- Mute
- Subscribe to RSS Feed
- Permalink
- Report Inappropriate Content
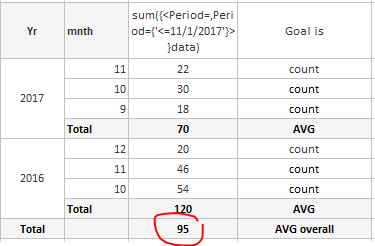
Is this the goal?
Used this
Avg({<Period=,Period={'<=$(=max(Period))'}>}aggr(sum({<Period=,Period={'<=$(=max(Period))'}>}data),Yr))
- Mark as New
- Bookmark
- Subscribe
- Mute
- Subscribe to RSS Feed
- Permalink
- Report Inappropriate Content
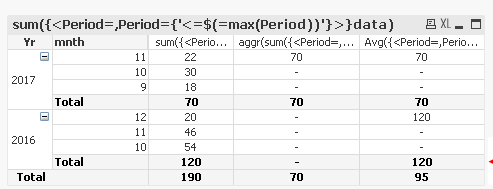
Desired state is where total for year would be AVG, right now with this change in statement we have sum as total for year and overall is AVG but in separate column. If I get Goal is shown below is Ideal but even if I have 70/120 sum as totals and 95 (AVG) as overall total I would be happy and not spending time any further.
- « Previous Replies
-
- 1
- 2
- Next Replies »