Unlock a world of possibilities! Login now and discover the exclusive benefits awaiting you.
- Qlik Community
- :
- All Forums
- :
- QlikView App Dev
- :
- lock down line chart to stop filters effecting dat...
- Subscribe to RSS Feed
- Mark Topic as New
- Mark Topic as Read
- Float this Topic for Current User
- Bookmark
- Subscribe
- Mute
- Printer Friendly Page
- Mark as New
- Bookmark
- Subscribe
- Mute
- Subscribe to RSS Feed
- Permalink
- Report Inappropriate Content
lock down line chart to stop filters effecting data it shows
Hello
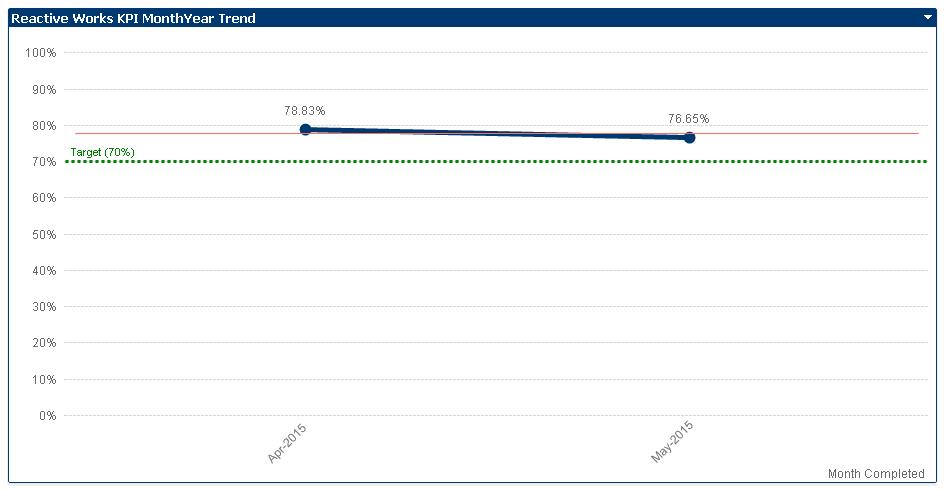
I have a line chart which will show (over time) a MonthYear trend for a KPI measure. I do not want the chart object to be influenced by any selection or filters applied anywhere else in the dashboard - effectively 'locking it down' to always show the same data, which will be all the MonthYear values from the MonthYear dimension.
I cant get it to do this and have played around with the best position to but the identifiers in the set analysis expression, which is as follows:
=num(count(DISTINCT {1<[Date Requested]={'>=01/04/2015'},CompReactiveWorksKPI={'yes'}, status_cat={'closed'}>} if(Aggr({1} max([DateTime Finished]<[DateTime of Escalation Completion]), [Work Request Code]), [Work Request Code]))/
count(DISTINCT {1<[Date Requested]={'>=01/04/2015'},CompReactiveWorksKPI={'yes'}, status_cat={'closed'}>}[Work Request Code]), '#,##0.00%')

Any ideas where I'm going wrong??
- Mark as New
- Bookmark
- Subscribe
- Mute
- Subscribe to RSS Feed
- Permalink
- Report Inappropriate Content
Your aggr-part with the max-function looked quite strange and it's not clear what d you want to do on this step. I suggest you split the expression in parts in another table-chart. First without set analysis and if this worked you add step by step more complexity.
Alternative to your set analysis filter you could check if to detach the chart or the use of alternate states:
Qlikview-Alternate States Fundamental-Inheritted vs Default
- Marcus
- Mark as New
- Bookmark
- Subscribe
- Mute
- Subscribe to RSS Feed
- Permalink
- Report Inappropriate Content
For what I can see without the qvw there are a few errors, especially in this part:
if(Aggr({1} max([DateTime Finished]<[DateTime of Escalation Completion]), [Work Request Code]),[Work Request Code])
Try with
=num(count(DISTINCT {1<[Date Requested]={'>=01/04/2015'},CompReactiveWorksKPI={'yes'}, status_cat={'closed'},[DateTime of Escalation Completion]={">=$(=max([DateTime Finished]))"}>} [Work Request Code])
/
count(DISTINCT {1<[Date Requested]={'>=01/04/2015'},CompReactiveWorksKPI={'yes'}, status_cat={'closed'}>}[Work Request Code]), '#,##0.00%')
If that does not work you will need to share a sample qvw
- Mark as New
- Bookmark
- Subscribe
- Mute
- Subscribe to RSS Feed
- Permalink
- Report Inappropriate Content
Hi,
You can try Alternate states or you can try this expression
=num(count(DISTINCT {1<[Date Requested]={'>=01/04/2015'},CompReactiveWorksKPI={'yes'}, status_cat={'closed'}>} if(Aggr({1} max({1}[DateTime Finished]<[DateTime of Escalation Completion]), [Work Request Code]),[Work Request Code]))/
count({1}DISTINCT {1<[Date Requested]={'>=01/04/2015'},CompReactiveWorksKPI={'yes'}, status_cat={'closed'}>}[Work Request Code]), '#,##0.00%')
Hope this helps you.
Regards,
Jagan.