Unlock a world of possibilities! Login now and discover the exclusive benefits awaiting you.
- Qlik Community
- :
- All Forums
- :
- QlikView App Dev
- :
- Re: modelling data with several date dim
- Subscribe to RSS Feed
- Mark Topic as New
- Mark Topic as Read
- Float this Topic for Current User
- Bookmark
- Subscribe
- Mute
- Printer Friendly Page
- Mark as New
- Bookmark
- Subscribe
- Mute
- Subscribe to RSS Feed
- Permalink
- Report Inappropriate Content
modelling data with several date dim
I'm trying to figure out how to build this app
I've 2 sets of data
OnlineCourseEnrollment
studentID, EnrollDate
1,'2016-01-01'
2,'2016-01-01'
3,'2016-01-01'
2,'2016-02-01'
4,'2016-02-01'
5,'2016-02-01'
Certification
studentID, PassingDate
1,'2016-01-29'
3,'2016-02-25'
2,'2016-02-25'
Should I use two different date dim one for PassingDate and one for Enroll? What is the expression to use?
The questions are liked, given a date range, what is the % of student passing. For example.
How many percentage pass based on Jan, 2016 Enroll
(student 1,3)/(student 1, 2, 3)
=2/3 <- what would be the expression to use to determine this?
How many percentage pass for all time
(student 1, 2, 3)/(student 1, 2, 3, 4, 5)
=3/5 <- what would be the expression to use to determine this?
How many percentage pass based on Feb Enroll
(student 2)/(student 2, 4, 5)
=1/3 <- what would be the expression to use to determine this?
Should I combine them into one single table? liked
studentID, EnrollDate, PassingDate
1,'2016-01-01', '2016-01-29'
2,'2016-01-01',
3,'2016-01-01', '2016-02-25'
2,'2016-02-01', '2016-02-25'
4,'2016-02-01'
5,'2016-02-01'
- « Previous Replies
-
- 1
- 2
- Next Replies »
- Mark as New
- Bookmark
- Subscribe
- Mute
- Subscribe to RSS Feed
- Permalink
- Report Inappropriate Content
How is Jan 2016 2/3? 3 is graduating in Feb, no?
- Mark as New
- Bookmark
- Subscribe
- Mute
- Subscribe to RSS Feed
- Permalink
- Report Inappropriate Content
I would say yes, join them into one table.
This will cover both the first and second question:
count({<PassingDate={">=[Starting Date]<=[Ending Date]"}>}distinct studentID)/count({<EnrollDate={">=[Starting Date]<=[Ending Date]"}>}distinct studentID)
Just replace the start date and end date with whatever figure you are after.
This will cover the all time question:
count({<PassingDate={"*"}>} distinct studentID)/count(distinct studentID)
With this one you can remove the 'distinct' if you want to included students that have enrolled twice (#2)
Hope this helps! 
- Mark as New
- Bookmark
- Subscribe
- Mute
- Subscribe to RSS Feed
- Permalink
- Report Inappropriate Content
Good point.
students enrolled in Jan are students 1, 2, 3.
OnlineCourseEnrollment
studentID, EnrollDate
1,'2016-01-01'
2,'2016-01-01'
3,'2016-01-01'
Certied ones
Certification
studentID, PassingDate
1,'2016-01-29'
3,'2016-02-25'
2,'2016-02-25'
so, Jan Enroll actually has 100% Cert. Of those, 2/3 did it in first try. 1/3 had to do it in second.
Back to the original question, how to model this in Qlik?
- Mark as New
- Bookmark
- Subscribe
- Mute
- Subscribe to RSS Feed
- Permalink
- Report Inappropriate Content
Is this how it would be loaded?
studentID, EnrollDate, PassingDate
1,'2016-01-01', '2016-01-29'
2,'2016-01-01',
3,'2016-01-01', '2016-02-25'
2,'2016-02-01', '2016-02-25'
4,'2016-02-01'
5,'2016-02-01'
the expression =Count ({<PassingDate={"*"}>} DISTINCT StudentID)
is returning 5, while there are only 2 unique PassingDate and 3 people having PassingDate
- Mark as New
- Bookmark
- Subscribe
- Mute
- Subscribe to RSS Feed
- Permalink
- Report Inappropriate Content
Please provide some more sample data.
or else merge both tables.
- Mark as New
- Bookmark
- Subscribe
- Mute
- Subscribe to RSS Feed
- Permalink
- Report Inappropriate Content
try this it will give student id whose passing and certification month is same.
IF(MONTH(ENROL_DATE)=MONTH([CERTIFICATION DATE]),Count(Student_id))
- Mark as New
- Bookmark
- Subscribe
- Mute
- Subscribe to RSS Feed
- Permalink
- Report Inappropriate Content
HI ben,
You have 2 options:
- Use a canonical calendar.
- Create only one fact table with one date only and one field to know if your record is Enroll or Cert
Regards!!
- Mark as New
- Bookmark
- Subscribe
- Mute
- Subscribe to RSS Feed
- Permalink
- Report Inappropriate Content
I think your data is already associated using studentID, the complexity lies in calculating measures keeping in mind multiple enrollment from the same student, I tried to create a sample, see if it can be of any help - 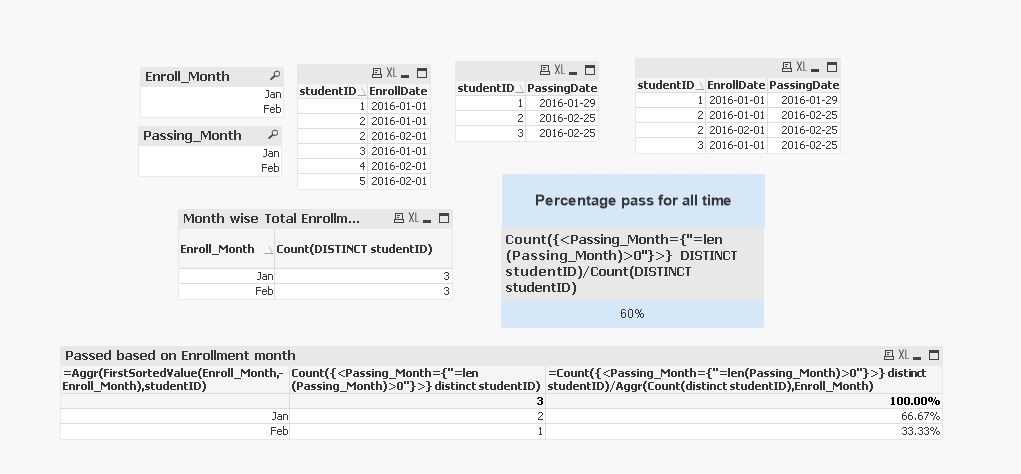
- Mark as New
- Bookmark
- Subscribe
- Mute
- Subscribe to RSS Feed
- Permalink
- Report Inappropriate Content
Are you using NullAsValue *; in your load script? If so, the "*" will read the null value as an empty string and include it in the returned value. If you have NullAsValue in your script remove it if you do not really need it. Otherwise you could use ">1" in place of the "*"
- « Previous Replies
-
- 1
- 2
- Next Replies »