Unlock a world of possibilities! Login now and discover the exclusive benefits awaiting you.
- Qlik Community
- :
- All Forums
- :
- QlikView App Dev
- :
- moving average
- Subscribe to RSS Feed
- Mark Topic as New
- Mark Topic as Read
- Float this Topic for Current User
- Bookmark
- Subscribe
- Mute
- Printer Friendly Page
- Mark as New
- Bookmark
- Subscribe
- Mute
- Subscribe to RSS Feed
- Permalink
- Report Inappropriate Content
moving average
Hallo QV Community
I use the following formula in the chart for accounting the moving average:
Rangesum(above(Y,0,Row())/Row()
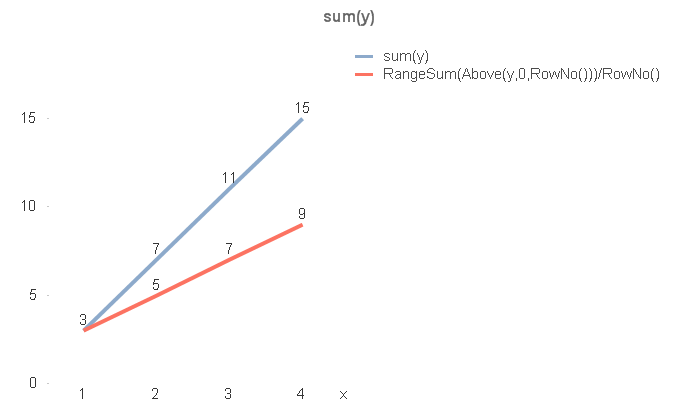
Is there any possibility to export the last value (=9) of the Rangesum formula to a textbox?
I tried to use the Rangesum formula within a textbox but it doesnt work for specific month.
The reason why i want to get this value to a textbox is because i need the value exported per macro to a powerpoint
document as picture or as object.
any ideas?
thanks for your help
Accepted Solutions
- Mark as New
- Bookmark
- Subscribe
- Mute
- Subscribe to RSS Feed
- Permalink
- Report Inappropriate Content
- Mark as New
- Bookmark
- Subscribe
- Mute
- Subscribe to RSS Feed
- Permalink
- Report Inappropriate Content
try to aggregate over y and take the max, something like :
Rangemax(aggr(rangesum(above(y,0,Rowno())), y))
- Mark as New
- Bookmark
- Subscribe
- Mute
- Subscribe to RSS Feed
- Permalink
- Report Inappropriate Content
thank you for your tip. the following formula works for me
max(aggr(rangesum(above(y,0,Rowno()))/RowNo(), y))
But what if the actual value is not the max value? then the value will not be shown in the textbox.
any ideas?
- Mark as New
- Bookmark
- Subscribe
- Mute
- Subscribe to RSS Feed
- Permalink
- Report Inappropriate Content
add firstsortedvalue function in the expression based on x axis instead of rangemax
- Mark as New
- Bookmark
- Subscribe
- Mute
- Subscribe to RSS Feed
- Permalink
- Report Inappropriate Content
ok, now i have:
FirstSortedValue(aggr(rangesum(above(y,0,Rowno()))/RowNo(),y),x)
that gives me the firstvalue (=3), but i need the last value (=9)
what a pitty that there is no lastsortedvalue function in QV
any ideas?
- Mark as New
- Bookmark
- Subscribe
- Mute
- Subscribe to RSS Feed
- Permalink
- Report Inappropriate Content
FirstSortedValue(aggr(rangesum(above(y,0,Rowno()))/RowNo(),y), -x)

- Mark as New
- Bookmark
- Subscribe
- Mute
- Subscribe to RSS Feed
- Permalink
- Report Inappropriate Content
Thank u very much 