Unlock a world of possibilities! Login now and discover the exclusive benefits awaiting you.
- Qlik Community
- :
- All Forums
- :
- QlikView App Dev
- :
- Re: need a mekko chart with segment n division dis...
- Subscribe to RSS Feed
- Mark Topic as New
- Mark Topic as Read
- Float this Topic for Current User
- Bookmark
- Subscribe
- Mute
- Printer Friendly Page
- Mark as New
- Bookmark
- Subscribe
- Mute
- Subscribe to RSS Feed
- Permalink
- Report Inappropriate Content
need a mekko chart with segment n division distribution
Dear Team,
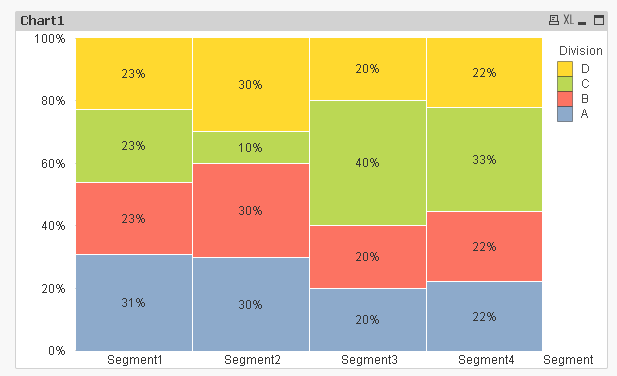
I need a mekko chart that displays each segment wise data to 100%.The corresponding segment Total value should be displayed on the top of the bar chart over each segment.Concerned Division name should appear inside the bar along with values.
Please help me out regarding this as it is required on high priority and please find the attached Excel and Qvw.
thanks
Hari
- Mark as New
- Bookmark
- Subscribe
- Mute
- Subscribe to RSS Feed
- Permalink
- Report Inappropriate Content
May be this:
=Num(Sum({<Division>}Orders)/Sum(TOTAL <Segment> {<Segment=>} Orders),'##%')
- Mark as New
- Bookmark
- Subscribe
- Mute
- Subscribe to RSS Feed
- Permalink
- Report Inappropriate Content
Hi,
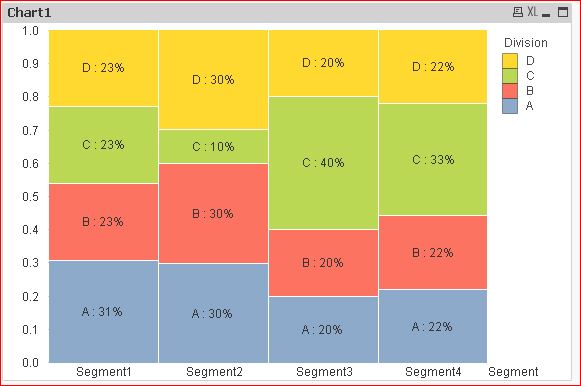
Just to add from sunny's suggestion, If you want to display your Division name inside the Chart (like below screen shot)
you can try the below expression.. Not sure about the Total value on top of each segment..
=Dual(Division&' : '& num(sum({<Division>}Orders)/sum(TOTAL <Segment> {<Segment=>} Orders),'##%')
,num(sum({<Division>}Orders)/sum(TOTAL <Segment> {<Segment=>} Orders),'##%'))
In the Number Tab -> Expression Default should be enable
- Mark as New
- Bookmark
- Subscribe
- Mute
- Subscribe to RSS Feed
- Permalink
- Report Inappropriate Content
Hi Sunny and Settu,
Thank you for ur prompt response and it has been very useful for me.I have 2 more queries...Please help me out regarding this.
1.Each Segment width should be based on Segment Value.Here all the segment widths are showing up at the same size.
2.On the top of each segment i want the Total value of each segment to be placed.
Please help me out regarding the above 2 queries.
Thank you.
Regards,
Hari
- Mark as New
- Bookmark
- Subscribe
- Mute
- Subscribe to RSS Feed
- Permalink
- Report Inappropriate Content
Hi Hari,
I don't think the above two mentioned is possible.
May be for the 2nd one, you can create one more chart and place it in the bottom with transparent option..
Check the Attachment (This is not the good solution)
- Mark as New
- Bookmark
- Subscribe
- Mute
- Subscribe to RSS Feed
- Permalink
- Report Inappropriate Content
Hi settu,
Thanks for ur response.One more query,can i represent the percentage in the bottom chart along with the numbers for eg..13000(35%) in the bar of the bottom chart.
Can u pls help me out regarding this.
Regards,
Hari