Unlock a world of possibilities! Login now and discover the exclusive benefits awaiting you.
- Qlik Community
- :
- All Forums
- :
- QlikView App Dev
- :
- Re: new expression for calculated values from char...
- Subscribe to RSS Feed
- Mark Topic as New
- Mark Topic as Read
- Float this Topic for Current User
- Bookmark
- Subscribe
- Mute
- Printer Friendly Page
- Mark as New
- Bookmark
- Subscribe
- Mute
- Subscribe to RSS Feed
- Permalink
- Report Inappropriate Content
new expression for calculated values from chart
Hi,
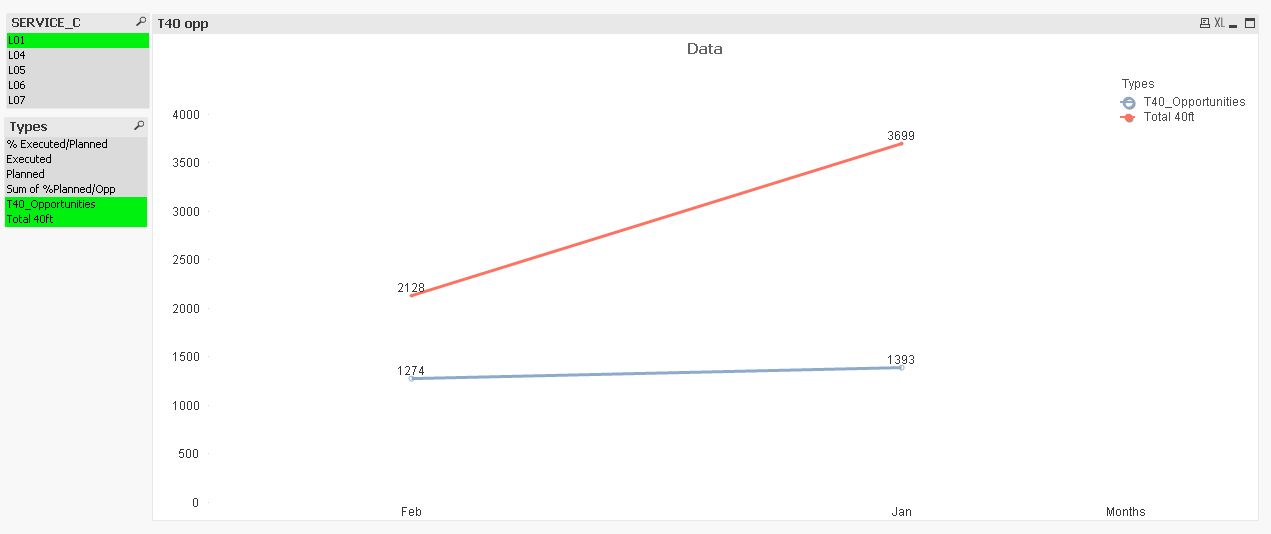
anyone able to help. I need to have another line or symbol to represent the percentage of T40_Oppo vs Total 40ft
Both of these values belong to the 'field', <Types>.
so at Feb there should show 59.8% and Jan 37.6%
thank you so much
Accepted Solutions
- Mark as New
- Bookmark
- Subscribe
- Mute
- Subscribe to RSS Feed
- Permalink
- Report Inappropriate Content
Hi,
You will have to change the dimension and expressions.
Your chart dimesion should be. --- Month
Expressions should be.
1. Sum({<Types = {"T40_Opportunities"}>}Value)
2. Sum({<Types = {"Total 40ft"}>}Value)
3. Sum({<Types = {"T40_Opportunities"}>}Value) / Sum({<Types = {"Total 40ft"}>}Value)
Regards,
Kaushik Solanki
- Mark as New
- Bookmark
- Subscribe
- Mute
- Subscribe to RSS Feed
- Permalink
- Report Inappropriate Content
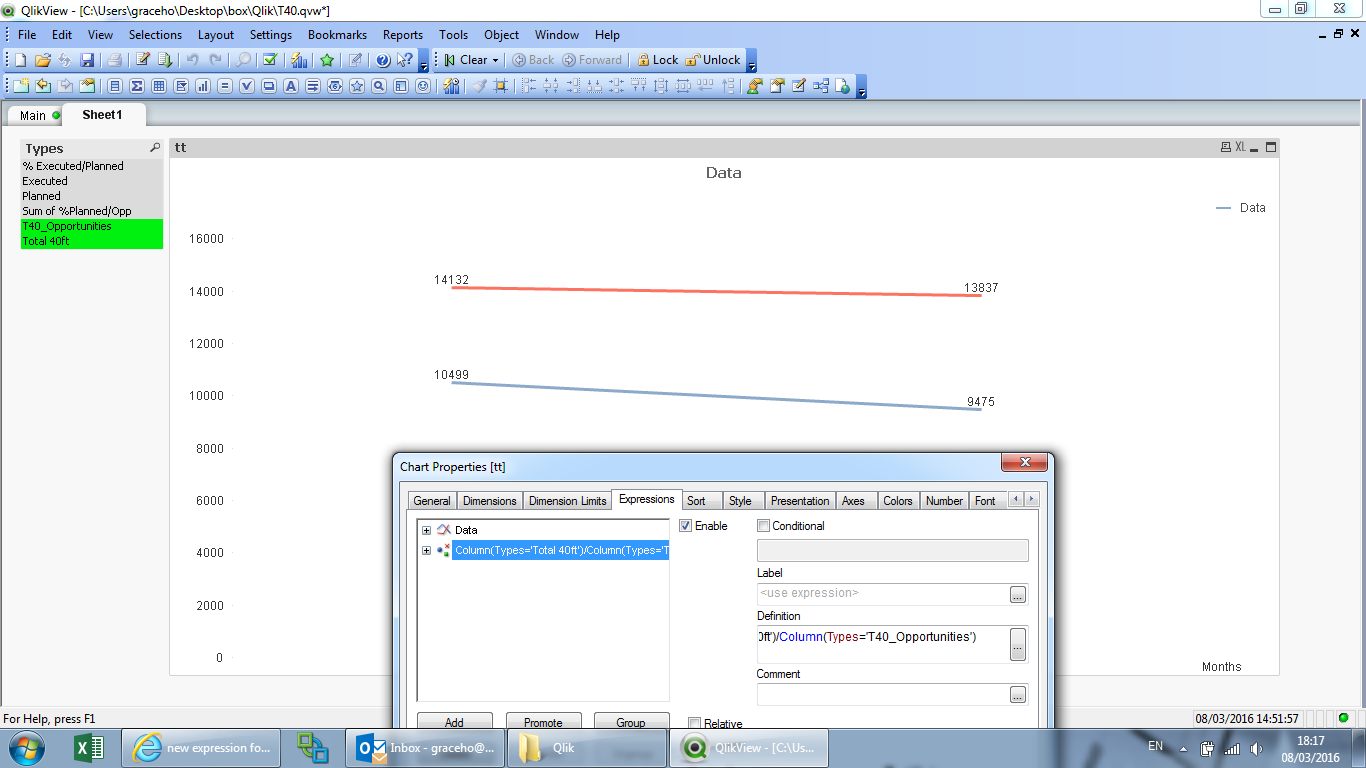
Hi,
You can use the Column(2)/Column(1) as Expression and change the number format to % from Number Tab.
Regards,
Kaushik Solanki
- Mark as New
- Bookmark
- Subscribe
- Mute
- Subscribe to RSS Feed
- Permalink
- Report Inappropriate Content
Hi,
the above does not work. I'm not sure if the expression should be changed or used as it is
- Mark as New
- Bookmark
- Subscribe
- Mute
- Subscribe to RSS Feed
- Permalink
- Report Inappropriate Content
Hi,
You will have to change the dimension and expressions.
Your chart dimesion should be. --- Month
Expressions should be.
1. Sum({<Types = {"T40_Opportunities"}>}Value)
2. Sum({<Types = {"Total 40ft"}>}Value)
3. Sum({<Types = {"T40_Opportunities"}>}Value) / Sum({<Types = {"Total 40ft"}>}Value)
Regards,
Kaushik Solanki
- Mark as New
- Bookmark
- Subscribe
- Mute
- Subscribe to RSS Feed
- Permalink
- Report Inappropriate Content
Would you be able to share your qvw file?
- Mark as New
- Bookmark
- Subscribe
- Mute
- Subscribe to RSS Feed
- Permalink
- Report Inappropriate Content
Hi Hi,
thank you so much. I used the expressions that you gave and got the presentation in the manner needed.
cheers!

- Mark as New
- Bookmark
- Subscribe
- Mute
- Subscribe to RSS Feed
- Permalink
- Report Inappropriate Content
Great..
Cheers..