Unlock a world of possibilities! Login now and discover the exclusive benefits awaiting you.
- Qlik Community
- :
- All Forums
- :
- QlikView App Dev
- :
- Re: Re: not display labels in a Map Chart !
- Subscribe to RSS Feed
- Mark Topic as New
- Mark Topic as Read
- Float this Topic for Current User
- Bookmark
- Subscribe
- Mute
- Printer Friendly Page
- Mark as New
- Bookmark
- Subscribe
- Mute
- Subscribe to RSS Feed
- Permalink
- Report Inappropriate Content
not display labels in a Map Chart !
Hi every One;
I create a chart cloud points ( nuage des points) on which we show the quantities sold to each region.
I have included using an excel file altitudes and longitudes. Displaying the map in the dashboard, I uncheck 'Text as tooltip' but the values of X and Y appeared in linfo bubble as shown in the picture if joint.
As I can not put an invisible expression, how can I hide the values of X and Y?
Another point is how to display the tooltip the word "QTE" before the value of the Quantity.
thank you
- Mark as New
- Bookmark
- Subscribe
- Mute
- Subscribe to RSS Feed
- Permalink
- Report Inappropriate Content
You will want to uncheck Pop-up Labels on the Presentation tab.
If you want to include other information in the pop up you can do this by adding additional expressions and checking Text As Popup on the Expression tab.
Hope that helps,
Steve
- Mark as New
- Bookmark
- Subscribe
- Mute
- Subscribe to RSS Feed
- Permalink
- Report Inappropriate Content
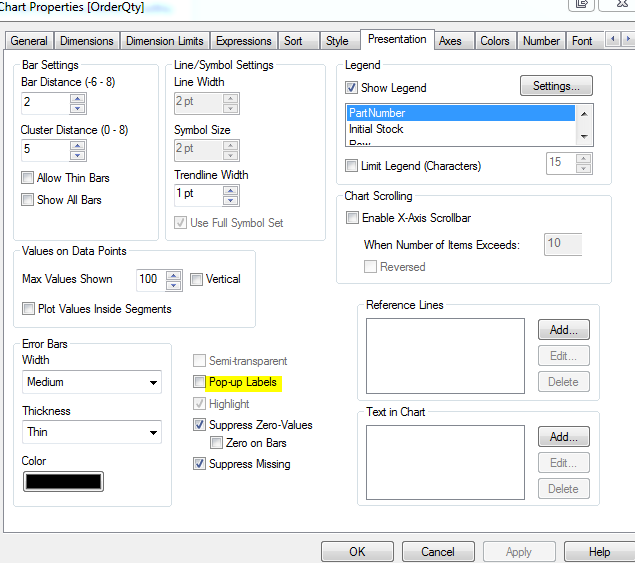
You'll need to uncheck Pop-up Labels in the Presentation Tab as well:
Then if you want QTE in a pop-up label, you'll need to add another expression like:
='QTE' & Quantity
Then make sure only Text as Pop up is checked for that expression.
Hope this helps!
- Mark as New
- Bookmark
- Subscribe
- Mute
- Subscribe to RSS Feed
- Permalink
- Report Inappropriate Content
I Can't uncheck Pop-up Labels in the Presentation Tab .
- Mark as New
- Bookmark
- Subscribe
- Mute
- Subscribe to RSS Feed
- Permalink
- Report Inappropriate Content
Hi,
It's the Eitquettes info-bulles check box. Can you not un-tick this?
-Steve