Unlock a world of possibilities! Login now and discover the exclusive benefits awaiting you.
- Qlik Community
- :
- All Forums
- :
- QlikView App Dev
- :
- null value in dimension column creates problem in ...
- Subscribe to RSS Feed
- Mark Topic as New
- Mark Topic as Read
- Float this Topic for Current User
- Bookmark
- Subscribe
- Mute
- Printer Friendly Page
- Mark as New
- Bookmark
- Subscribe
- Mute
- Subscribe to RSS Feed
- Permalink
- Report Inappropriate Content
null value in dimension column creates problem in above() function
Hi,
Below are the sample data that I am getting
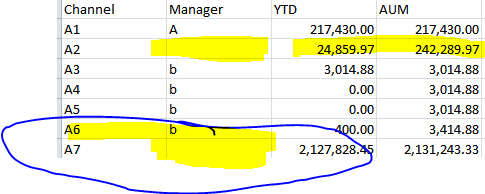
| Channel | Manager | YTD | AUM |
| A1 | A | 217,430.00 | 217,430.00 |
| A2 | 24,859.97 | 242,289.97 | |
| A3 | b | 3,014.88 | 3,014.88 |
| A4 | b | 0.00 | 3,014.88 |
| A5 | b | 0.00 | 3,014.88 |
| A6 | b | 400.00 | 3,414.88 |
| A7 | 2,127,828.45 | 2,131,243.33 |
and below is the set expression that I have used:-
rangesum(above(sum({$<[ProcDate]={">=$(=YearStart(Max([ProcDate]))) <=$(=Max([Process Date]))"}>}[Amt]),0,RowNo(TOTAL)))
to find out the accumulated value and we can see that whenever the values of Manager column is changed to Null value, we got the wrong value for AUM column and it does not adding up the row values with preceding row.
So is that any suggestion for this?
Accepted Solutions
- Mark as New
- Bookmark
- Subscribe
- Mute
- Subscribe to RSS Feed
- Permalink
- Report Inappropriate Content
Hi,
Here is my answer :
I have the below data
AMT CUM Val
1 1
2 3
3 6
4 10
5 15
6 21
7 28
8 36
9 45
You can see that for 2nd column, we need to add cumulative sum of values based on first column and I have used the below set expression:-
rangesum(Above(sum([Sales Amt]),0,RowNo(TOTAL)))
Now if any row is NULL for any column, then the cumulative value will be lost and will give us wrong result. For example: for the below data we will get
wrong result as because we have null value in AMT column.
AMT CUM Val
1 1
2 3
3 6
10
5 15
6 21
28
8 36
9 45
To overcome this problem we have use the below set expression:
rangesum(above(Total sum({$<[Process Date]={">=$(=YearStart(Max([Process Date]))) <=$(=Max([Process Date]))"}>}[Sales Amt]),0, RowNo(TOTAL)),
[Manager Full Name]=>, [Wholesaler Full Name]=>, [Rep Full Name]=>, [Firm Name]=>, [Address Line1]=>, City=>, [Geo State Code]=>, [Zip Code]=>, [Phone Number 1]=>)
where we have to use TOTAL qualifier at above() function like :
rangesum(above(total sum(Col), 0, rowno(total)), Dim Col1=>, Dim Col2=>, Dim Col3=>)
where
Dim Col1, Dim Col2, Dim Col3 are the domension columns in the chart and '=>' is to be used to disreguard that dimension collumns,
so that if any row value is NULL() there, our cumulative value will not be effected.
- Mark as New
- Bookmark
- Subscribe
- Mute
- Subscribe to RSS Feed
- Permalink
- Report Inappropriate Content
Give this a try:
...above(TOTAL ...
- Marcus
- Mark as New
- Bookmark
- Subscribe
- Mute
- Subscribe to RSS Feed
- Permalink
- Report Inappropriate Content
where is the null value in dimension ?
- Mark as New
- Bookmark
- Subscribe
- Mute
- Subscribe to RSS Feed
- Permalink
- Report Inappropriate Content
hi,
I am highlighted the missing data area in the below image. Please look into this issue:
Thanks,
Sandip
- Mark as New
- Bookmark
- Subscribe
- Mute
- Subscribe to RSS Feed
- Permalink
- Report Inappropriate Content
the measure name involved is YTD or Amt ?
- Mark as New
- Bookmark
- Subscribe
- Mute
- Subscribe to RSS Feed
- Permalink
- Report Inappropriate Content
hi,
It is YTD
- Mark as New
- Bookmark
- Subscribe
- Mute
- Subscribe to RSS Feed
- Permalink
- Report Inappropriate Content
Hi,
Here is my answer :
I have the below data
AMT CUM Val
1 1
2 3
3 6
4 10
5 15
6 21
7 28
8 36
9 45
You can see that for 2nd column, we need to add cumulative sum of values based on first column and I have used the below set expression:-
rangesum(Above(sum([Sales Amt]),0,RowNo(TOTAL)))
Now if any row is NULL for any column, then the cumulative value will be lost and will give us wrong result. For example: for the below data we will get
wrong result as because we have null value in AMT column.
AMT CUM Val
1 1
2 3
3 6
10
5 15
6 21
28
8 36
9 45
To overcome this problem we have use the below set expression:
rangesum(above(Total sum({$<[Process Date]={">=$(=YearStart(Max([Process Date]))) <=$(=Max([Process Date]))"}>}[Sales Amt]),0, RowNo(TOTAL)),
[Manager Full Name]=>, [Wholesaler Full Name]=>, [Rep Full Name]=>, [Firm Name]=>, [Address Line1]=>, City=>, [Geo State Code]=>, [Zip Code]=>, [Phone Number 1]=>)
where we have to use TOTAL qualifier at above() function like :
rangesum(above(total sum(Col), 0, rowno(total)), Dim Col1=>, Dim Col2=>, Dim Col3=>)
where
Dim Col1, Dim Col2, Dim Col3 are the domension columns in the chart and '=>' is to be used to disreguard that dimension collumns,
so that if any row value is NULL() there, our cumulative value will not be effected.