Unlock a world of possibilities! Login now and discover the exclusive benefits awaiting you.
- Qlik Community
- :
- All Forums
- :
- QlikView App Dev
- :
- Re: only min value in pivot
- Subscribe to RSS Feed
- Mark Topic as New
- Mark Topic as Read
- Float this Topic for Current User
- Bookmark
- Subscribe
- Mute
- Printer Friendly Page
- Mark as New
- Bookmark
- Subscribe
- Mute
- Subscribe to RSS Feed
- Permalink
- Report Inappropriate Content
only min value in pivot
Hi Folks,
i have a situation:
Year:
2016 300 €
2015 200 €
2014 100 €
How can i make visible on pivot-table this structure; i want to ignore the values 300€ and 200€ and show only 100 €
Year
2016 0 €
2015 0 €
2014 100 €
Thanks a lot
beck
- « Previous Replies
-
- 1
- 2
- Next Replies »
- Mark as New
- Bookmark
- Subscribe
- Mute
- Subscribe to RSS Feed
- Permalink
- Report Inappropriate Content
Hi Sunny,
sorry for my late response, my issue is: i want to see the calculated values and if it possible, to see the minimum of calculated value
thanks a lot for you help
beck
- Mark as New
- Bookmark
- Subscribe
- Mute
- Subscribe to RSS Feed
- Permalink
- Report Inappropriate Content
I am looking for numerical numbers you expect to see and not the description. Would you be able to give me the numbers you are hoping to see my friend?
- Mark as New
- Bookmark
- Subscribe
- Mute
- Subscribe to RSS Feed
- Permalink
- Report Inappropriate Content
Hi Sunny,
thanks a lot for your responce, i made a mistake: under calculated values : i mean a cumulated value.
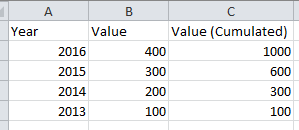
pleas look at attached screenshots, i want to see the cumulated values and if i select both year: for instance: 2014 and 2013, i want to see only 100 (cumulated values) within a straight table /pivot
i hope i explained well,
thanks a lot for your help
- Mark as New
- Bookmark
- Subscribe
- Mute
- Subscribe to RSS Feed
- Permalink
- Report Inappropriate Content
If you select 2015 and 2016, what would you want to see? 600 (value accumulated since 2013 or 300 (where accumulation will start from 2015)?
- Mark as New
- Bookmark
- Subscribe
- Mute
- Subscribe to RSS Feed
- Permalink
- Report Inappropriate Content
if i select 2015 i want to see only 600
- Mark as New
- Bookmark
- Subscribe
- Mute
- Subscribe to RSS Feed
- Permalink
- Report Inappropriate Content
Try this:
Sum({<Year = {$(=Min(Year))}>}Aggr(RangeSum(Above(Sum({<Year>} Value), 0, RowNo())), (Year, (NUMERIC))))
- Mark as New
- Bookmark
- Subscribe
- Mute
- Subscribe to RSS Feed
- Permalink
- Report Inappropriate Content
Sunny Thanks a lot for your help and taking the time to help
- Mark as New
- Bookmark
- Subscribe
- Mute
- Subscribe to RSS Feed
- Permalink
- Report Inappropriate Content
No problem at all 
- « Previous Replies
-
- 1
- 2
- Next Replies »