Unlock a world of possibilities! Login now and discover the exclusive benefits awaiting you.
- Qlik Community
- :
- All Forums
- :
- QlikView App Dev
- :
- Re: outer line in Pie Chart
- Subscribe to RSS Feed
- Mark Topic as New
- Mark Topic as Read
- Float this Topic for Current User
- Bookmark
- Subscribe
- Mute
- Printer Friendly Page
- Mark as New
- Bookmark
- Subscribe
- Mute
- Subscribe to RSS Feed
- Permalink
- Report Inappropriate Content
outer line in Pie Chart
Hi Everyone, Is it possible to remove outer black line from the pie chart?? I am attaching the snapshot, plz have a look. Thanx in advance.....
- Mark as New
- Bookmark
- Subscribe
- Mute
- Subscribe to RSS Feed
- Permalink
- Report Inappropriate Content
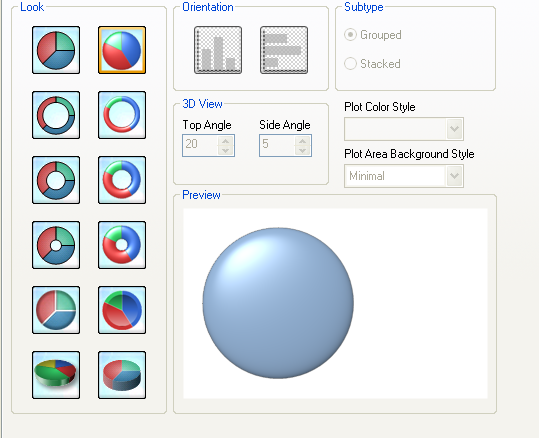
i would suggest you.. choose a different style..
- Mark as New
- Bookmark
- Subscribe
- Mute
- Subscribe to RSS Feed
- Permalink
- Report Inappropriate Content
Hello Kumar,
unfortunately you cannot change that color. The outline defines the actual border of the pie chart.
We do not have control over it.
By the way - If we remove that color then Pie chart might take the multi-color according to Pie area which will look odd. (Just a thought)
Thanks,
Advait
https://www.linkedin.com/groups/6513382/
- Mark as New
- Bookmark
- Subscribe
- Mute
- Subscribe to RSS Feed
- Permalink
- Report Inappropriate Content
Thanx Aadil and Advait for Reply.
Aadil,
I need to have plain Pie chart, I cannot go for 3D or gradient style Pie chart. Is any other way to remove the black outer line?
Advait,
The requirement is like this only. Are u sure that we cannot remove the black outer line?
Regards,
Kumar
- Mark as New
- Bookmark
- Subscribe
- Mute
- Subscribe to RSS Feed
- Permalink
- Report Inappropriate Content
Yes Kumar, I am sure. As i said earlier we do not have any contorl over it.
Thanks,
Advait
https://www.linkedin.com/groups/6513382/
- Mark as New
- Bookmark
- Subscribe
- Mute
- Subscribe to RSS Feed
- Permalink
- Report Inappropriate Content
Thanx Advait for the reponse............
Is there any way to change that black outline color to any other color............say blue.................
- Mark as New
- Bookmark
- Subscribe
- Mute
- Subscribe to RSS Feed
- Permalink
- Report Inappropriate Content
Hello Kumar,
Its simple. I can understand what exactly you want to show since even i was expecting similar requirement.I have attached the screen shot for the same. In my attachment, i have used the gauge chart along with a rounded corner text box ( textbox converted to circle by playing with the corner radius and squareness option in the layout tab. Where in Corner radius block select fixed and set it to 95 pts and squareness to 2). So use a Gauge chart. Go in the style tab and select the 1st style. Go in presentation tab and un-check show scale textbox. Set Angle Span to 360 degree. Set cylinder thickness to 20. In indicator block set mode to 'no indicator'(which will remove the needle) . In caption tab uncheck 'Show caption'. In layout tab uncheck 'Use borders'. Goin colors tab and set transparency to 100%. Apply your expressions and set the lower and upper bound for the gauge as required. To make the chart look better resize the circular textbox and bring it to the center of the gauge chart. pls refer the attached image for more clarity.
- Mark as New
- Bookmark
- Subscribe
- Mute
- Subscribe to RSS Feed
- Permalink
- Report Inappropriate Content
Brilliant idea to use a gauge and a text box with rounded corners. I'll use it for my current project, thanks a lot for this inspiration!
- Mark as New
- Bookmark
- Subscribe
- Mute
- Subscribe to RSS Feed
- Permalink
- Report Inappropriate Content
You can use from sector outline in color tab in 11.02 SR10.