Unlock a world of possibilities! Login now and discover the exclusive benefits awaiting you.
- Qlik Community
- :
- All Forums
- :
- QlikView App Dev
- :
- overlaying bars / background-color class()
- Subscribe to RSS Feed
- Mark Topic as New
- Mark Topic as Read
- Float this Topic for Current User
- Bookmark
- Subscribe
- Mute
- Printer Friendly Page
- Mark as New
- Bookmark
- Subscribe
- Mute
- Subscribe to RSS Feed
- Permalink
- Report Inappropriate Content
overlaying bars / background-color class()
Hello everybody,
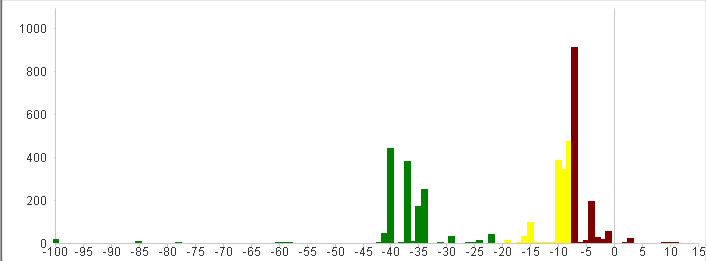
I want to display how many items are ordered before an event starts. So I got a simple data-model with two fields: DAYS_UNTIL_START and NUMBER showing the amount at the Special day-combination. I created a chart and added color (< -21 green, < -7 yellow, red) depending on the dimension to Highlight what I want to say. This is the result:

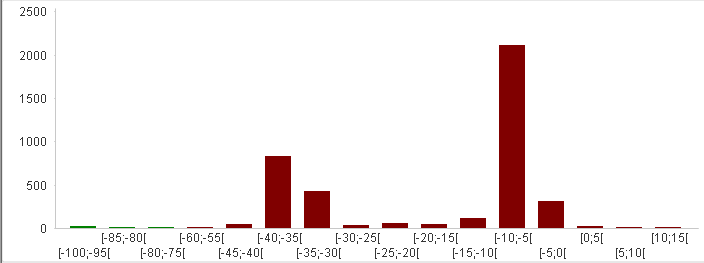
this Looks not bad, but there is one problem: the bars are overlaying each other! You can see this ad -8 (yellow) and -7 (red). To solve this I created another chart using class() to Cluster the data for an overall view. This is the result:

I grouped the data to a 5-day-corridor using class() to avoid overlaying bars. My problem with this chart are the wrong colors. It's too much red ![]()
So now I got two Problems. Can anybody help me solving one of These or even both?
Thank you very much!
- Mark as New
- Bookmark
- Subscribe
- Mute
- Subscribe to RSS Feed
- Permalink
- Report Inappropriate Content
Can you not just tweak the bar settings in the presentation tab of the chart properties to space the bars out more?
- Mark as New
- Bookmark
- Subscribe
- Mute
- Subscribe to RSS Feed
- Permalink
- Report Inappropriate Content
Not really. I choosed the Option continuous axis.