Unlock a world of possibilities! Login now and discover the exclusive benefits awaiting you.
- Qlik Community
- :
- All Forums
- :
- QlikView App Dev
- :
- peek with If condition
- Subscribe to RSS Feed
- Mark Topic as New
- Mark Topic as Read
- Float this Topic for Current User
- Bookmark
- Subscribe
- Mute
- Printer Friendly Page
- Mark as New
- Bookmark
- Subscribe
- Mute
- Subscribe to RSS Feed
- Permalink
- Report Inappropriate Content
peek with If condition
Hi Friends
I have developed the attached QVW file with help from the friends in community. Now I have come the final stage where I do not get the expected output. In otherwords in my data table if the Two Policy nos match and Monthend period match and NEP+NEP (of two policies )is zero NEP amount sholud show Zero in both policies(rows). I have attched my QV docoment. Kindly look into this and help me,
Current output report
Required Output Report
- « Previous Replies
-
- 1
- 2
- Next Replies »
Accepted Solutions
- Mark as New
- Bookmark
- Subscribe
- Mute
- Subscribe to RSS Feed
- Permalink
- Report Inappropriate Content
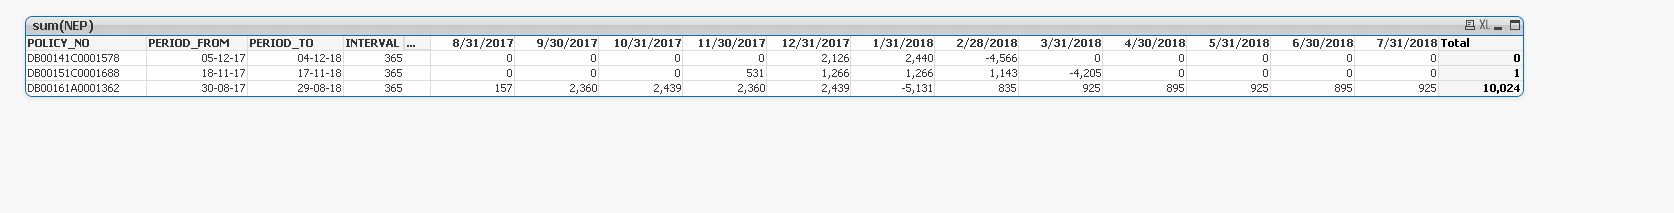
I am not able to find a way to calculate the correct total with the Pivot Table. However it is easy to do it with a Straight Table instead:
![2018-08-19 01_59_13-QlikView x64 - Evaluation Copy - [C__Users_pts_Documents_test2.qvw].png](/legacyfs/online/211230_2018-08-19 01_59_13-QlikView x64 - Evaluation Copy - [C__Users_pts_Documents_test2.qvw].png)
And to get the straight table's expressions and labels to be easier to handle I created these three variables:
vMonthEnd, vNEP and vTotal. They all take parameters as to how many months ago the expression should be calculated for.
Also a small helper table to get the months dynamic is needed. I just called it Cal. See attached QVW.
- Mark as New
- Bookmark
- Subscribe
- Mute
- Subscribe to RSS Feed
- Permalink
- Report Inappropriate Content
Hello,
If you are looking for something like this
- In the sheet Test of your QVW
- remove the dimensions
- Ref Number
- Trans Date
- In the presentation tab of your Pivot table Uncheck suppress zero values
If you want to keep the dimensions and see 0's then you might have to do the summation in the script itself.
- Mark as New
- Bookmark
- Subscribe
- Mute
- Subscribe to RSS Feed
- Permalink
- Report Inappropriate Content
thanks.
i Need both those field in my pivot table. If you can do with two fields pls help me.
- Mark as New
- Bookmark
- Subscribe
- Mute
- Subscribe to RSS Feed
- Permalink
- Report Inappropriate Content
If you substitute the Sum(NEP) expression in your test tab in the pivot table with this:
If(If(Odd(RowNo(TOTAL)),Sum(NEP)+Below(TOTAL Sum(NEP)),Above(TOTAL Sum(NEP))+Sum(NEP))=0,0,Sum(NEP))
You will get this:
![2018-08-18 10_57_35-QlikView x64 - Evaluation Copy - [C__Users_pts_Downloads_test.qvw_].png](/legacyfs/online/211213_2018-08-18 10_57_35-QlikView x64 - Evaluation Copy - [C__Users_pts_Downloads_test.qvw_].png)
I also set the Populate Missing Cells to nothing in the Presentation tab:

- Mark as New
- Bookmark
- Subscribe
- Mute
- Subscribe to RSS Feed
- Permalink
- Report Inappropriate Content
Or you might prefer a more accurate display of the values versus the missing values by using this expression:
If(If(Odd(RowNo(TOTAL)),Sum(NEP)+Below(TOTAL Sum(NEP)),Above(TOTAL Sum(NEP))+Sum(NEP))=0,Null(),Sum(NEP))
To get this:
![2018-08-18 11_03_43-QlikView x64 - Evaluation Copy - [C__Users_pts_Downloads_test.qvw_].png](/legacyfs/online/211227_2018-08-18 11_03_43-QlikView x64 - Evaluation Copy - [C__Users_pts_Downloads_test.qvw_].png)
By setting this:
![2018-08-18 11_04_01-Chart Properties [Sum NEP].png](/legacyfs/online/211228_2018-08-18 11_04_01-Chart Properties [Sum NEP].png)
- Mark as New
- Bookmark
- Subscribe
- Mute
- Subscribe to RSS Feed
- Permalink
- Report Inappropriate Content
Thanks Petter.
IT solves my issue except does not show values in total column in some rows. If you can pls also give a solution for that also.
THanks
- Mark as New
- Bookmark
- Subscribe
- Mute
- Subscribe to RSS Feed
- Permalink
- Report Inappropriate Content
I am not able to find a way to calculate the correct total with the Pivot Table. However it is easy to do it with a Straight Table instead:
And to get the straight table's expressions and labels to be easier to handle I created these three variables:
vMonthEnd, vNEP and vTotal. They all take parameters as to how many months ago the expression should be calculated for.
Also a small helper table to get the months dynamic is needed. I just called it Cal. See attached QVW.
- Mark as New
- Bookmark
- Subscribe
- Mute
- Subscribe to RSS Feed
- Permalink
- Report Inappropriate Content
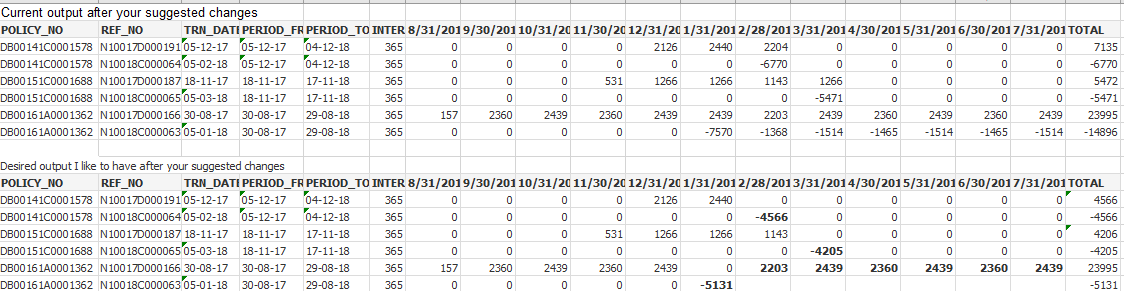
Thanks a lot Petter,
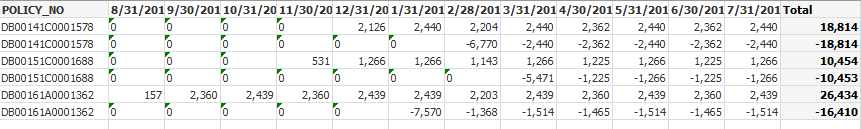
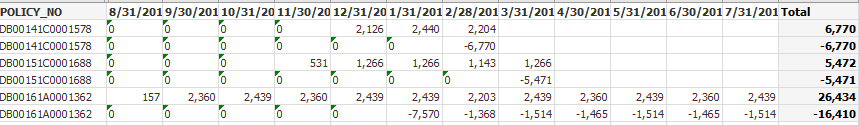
This is excatly what I was looking for. But If I am not disturbing you pls help me with futher development I require on the output report. In this report I want to show one row (postive or negative) which has higher value. I have shown my requrement in image below. pls also pay your attention tovalue in total column. Appreciate If you kindly help me .
- Mark as New
- Bookmark
- Subscribe
- Mute
- Subscribe to RSS Feed
- Permalink
- Report Inappropriate Content
 Maybe you should close this thread now - continously raising the bar is not how this forum is supposed to work
- Mark as New
- Bookmark
- Subscribe
- Mute
- Subscribe to RSS Feed
- Permalink
- Report Inappropriate Content
Sorry If I disturb you. Thank you for your great help
- « Previous Replies
-
- 1
- 2
- Next Replies »