Unlock a world of possibilities! Login now and discover the exclusive benefits awaiting you.
- Qlik Community
- :
- All Forums
- :
- QlikView App Dev
- :
- Re: performance issue
- Subscribe to RSS Feed
- Mark Topic as New
- Mark Topic as Read
- Float this Topic for Current User
- Bookmark
- Subscribe
- Mute
- Printer Friendly Page
- Mark as New
- Bookmark
- Subscribe
- Mute
- Subscribe to RSS Feed
- Permalink
- Report Inappropriate Content
performance issue
Hi All,
Our qv server configuration-
2 physical 8 core Intel Xeon e5-2690 @ 2.90Ghz
and 380 Gb RAM
The total size of all qlikview applications that the qlikview server is 70GB.
so even if all the qlikview applications are accessed by users(ie 70*3= 210 GB utilized) the server still have 170GB(380-210=170) memory free.
The biggests dashboard has approx 100 million rows.
From the qv access point, Whenever i click on any tab it takes approx 10 seconds to open and similarly all the charts in the that tab start taking approx 10 secods to fully load.
we have enabled preload in the qv server.
The expressions in the charts are not very complex..
I am not sure where to start troubleshooting this issue?
Regards,
Suraj
- Tags:
- new_to_qlikview
- « Previous Replies
-
- 1
- 2
- Next Replies »
- Mark as New
- Bookmark
- Subscribe
- Mute
- Subscribe to RSS Feed
- Permalink
- Report Inappropriate Content
How many visible charts are in a Tab? If you have mulitple charts it will take a while for them all to appear. You could use a container to host the charts so you show only 1 at a time.
By the way is 70Gb document size, the size on disk or in memory? Typically a document is 4x the size in memory as it is on disk.
- Mark as New
- Bookmark
- Subscribe
- Mute
- Subscribe to RSS Feed
- Permalink
- Report Inappropriate Content
Hi Shane,
Thanks !!
70gb is the size of all qvw's on disk where qv server is running. Yes, i am aware that size of 70gb in memory will be 70*3 approx..
=>To calcualte the RAM required i need to find the 'Source file size'. I am not sure what mean by source file. I assume it is the size of all the QVD's used in the final qvw. Am I right?
-If it is sise of all SOURCE tables used in QVD's, then how can i measure the size of each table in the disk in oracle db?
- Mark as New
- Bookmark
- Subscribe
- Mute
- Subscribe to RSS Feed
- Permalink
- Report Inappropriate Content
Hi Suraj. The source file size I believe is the size of the actual QVW on disk. So just go in to windows explorer and look at the document(s) properties / size.
I misread what you originally wrote, I thought you had 3 Documents each 70Gb each. But you've actually got several documents, the combined size on disk of which is 70GB correct?
n.b. The Disk to Memory size factor is actually closer to 4. But the best thing to do to check size requirements if you already have a server / environment is restart QVS so you clear memory, set all documents to preload and check in task manager to see how much memory is used and how big QVS grows before any users get on.
With regards to how much extra memory required for Users / Cached Results the sizing calculations are a bit abritary and can lead to inaccurate recomendations. It has little to do with user concurrency and more to do with what users are doing and how many of them are doing it between cache flushes. Typically adding more memory / RAM is at best a sticking plaster and you really need to understand the nature of the issue before considering up-sizing. What you can do though is tweak the Work Set Min to better use the available memory - at 380GB of RAM you could increase this considerably from the default to maybe 85-90%.
By the way does the same server act as both QlikView Server and Publisher server?
How many documents do you have? And how big is each individual document?
Preloaded is a good option if they're large documents that are used regularly. Are all the documents used regulary or are some infrequent.
- Mark as New
- Bookmark
- Subscribe
- Mute
- Subscribe to RSS Feed
- Permalink
- Report Inappropriate Content
Shane Spencer wrote:
By the way does the same server act as both QlikView Server and Publisher server?
We dont have publisher and qv server is non-clustered.
Shane Spencer wrote:
How many documents do you have? And how big is each individual document?
we have total of 75 qvw's and the biggest document size on disk is nearly 1gb
Shane Spencer wrote:
Are all the documents used regulary or are some infrequent.
Approx..All the doucments are used by end users regularly.
Shane Spencer wrote:
What you can do though is tweak the Work Set Min to better use the available memory - at 380GB of RAM you could increase this considerably from the default to maybe 85-90%.
So you mean, i should increase the RAM 85-90% of existing 380gb.
And, When i checked the qv server today, i see that there are 92 users currently using those 75 documents. The users always complain that the charts load really slow when they do selections.. So, the fastest way to resolve this issue seems to be increasing the RAM, but not sure how much RAM to increase based on the statistics i have provided..
- Mark as New
- Bookmark
- Subscribe
- Mute
- Subscribe to RSS Feed
- Permalink
- Report Inappropriate Content
How often do you reload documents? If you do not have a Publisher you need to take in to account the impact of reloads on your system.
1GB is not massive. We have documents of 8GB.
"Approx..All the doucments are used by end users regularly." How regularly? At least once an hour, day, week?
"So you mean, i should increase the RAM 85-90% of existing 380gb."
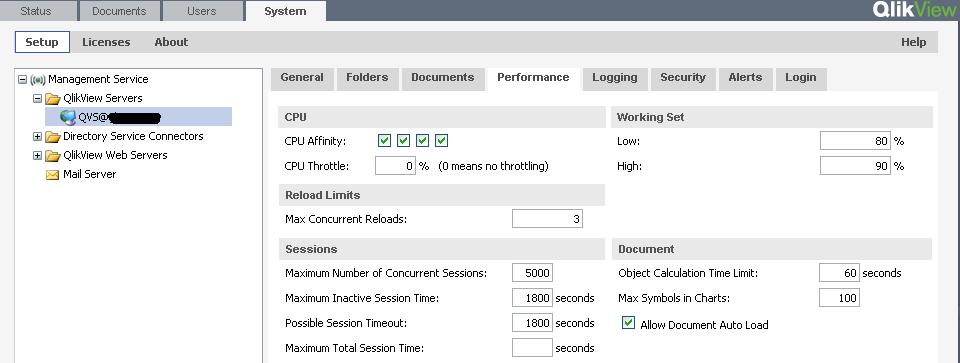
I mean you can tweak the working set low as per below. I think the default is 70%. This is the amount of the Servers RAM that QVS Process can use. If you set this to 70% then 114GB would be left for whatever else on the server requires RAM. You need to analyse what you memory requirements are for other processes but for example setting Working Set Low to 90% would still leave 38GB for everything else on the server.
This would mean you are making better use of your servers memory but it will not necessarily fix your issue. Please do not focus too heavily on memory / hardware, this is an easy trap to fall in to.
I would not recomend adding more RAM. This is unlikely to improve user performance! This sounds more like an issue with the document design. Again what does your dashboard look like? Are there many charts and objects visible on 1 sheet?
Check the basics though first. Go to task manager and see what CPU and Memory utilistation are like. Restart QVS and measure how long it takes for the size of the QVS process to get up to Work Set Low level. If you want to do this properly set up Perfmon to collect the following metrics:
\LogicalDisk(D:)\Avg. Disk Bytes/Transfer
\LogicalDisk(D:)\Avg. Disk sec/Read
\LogicalDisk(D:)\Avg. Disk sec/Write
\LogicalDisk(D:)\Current Disk Queue Length
\LogicalDisk(D:)\% Free Space
\LogicalDisk(D:)\Free Megabytes
\Memory\% Committed Bytes In Use
\Memory\Available MBytes
\Memory\Page Faults/sec
\Memory\Pages/sec
\Memory\Pool Nonpaged Bytes
\Memory\Page Reads/sec
\Network Interface(*)\Bytes Total/sec
\Network Interface(*)\Current Bandwidth
\Paging File(_Total)\% Usage
\PhysicalDisk(_Total)\% Disk Time
\PhysicalDisk(_Total)\Avg. Disk Bytes/Transfer
\PhysicalDisk(_Total)\Avg. Disk Queue Length
\Process(QVDistributionService)\% Processor Time
\Process(QVDistributionService)\Private Bytes
\Process(QVDistributionService)\Thread Count
\Process(QVDistributionService)\Virtual Bytes
\Process(QVDistributionService)\Working Set
\Process(QVDirectoryServiceConnector)\% Processor Time
\Process(QVManagementService)\% Processor Time
\Process(qvs)\% Processor Time
\Process(QVDirectoryServiceConnector)\Private Bytes
\Process(QVManagementService)\Private Bytes
\Process(qvs)\Private Bytes
\Process(QVDirectoryServiceConnector)\Thread Count
\Process(QVManagementService)\Thread Count
\Process(qvs)\Thread Count
\Process(QVDirectoryServiceConnector)\Virtual Bytes
\Process(QVManagementService)\Virtual Bytes
\Process(qvs)\Virtual Bytes
\Process(QVDirectoryServiceConnector)\Working Set
\Process(QVManagementService)\Working Set
\Process(qvs)\Working Set
\Processor(_Total)\% Interrupt Time
\Processor(_Total)\% Processor Time
\Processor(_Total)\Interrupts/sec
\QlikView Distribution Service\*
\QlikView Management Service\*
\System\Context Switches/sec
\System\Processor Queue Length
\Web Service(_Total)\Bytes Total/sec
\Web Service(_Total)\Current Connections
\Web Service(_Total)\Total Method Requests/sec
\Web Service Cache\File Cache Hits %
\Web Service Cache\Kernel: URI Cache Flushes
\Web Service Cache\Kernel: URI Cache Hits %
\Web Service Cache\Kernel: URI Cache Misses
Are the slow responses all the time? Or only at times of High Memory or High CPU utilisation? Expect spikes in CPU but not running constantly high. QlikView is an "In Memory" application so no matter how much memory you give it, it will use it eventually. You need enough for you Documents base footprint and a bit more for cached results. If memory running out / high causes an issue you can manage this with QVS Restarts or Cache Flush, but I don't believe this is the cause of your issue.
Your issue sounds more like poor document design. Are all Documents slow? Or just certain ones? Can you create a new tab of a large document with 1 simple chart and see if that tab is slow to load? You need to narrow down the cause of your issue by process of elimination.
- Mark as New
- Bookmark
- Subscribe
- Mute
- Subscribe to RSS Feed
- Permalink
- Report Inappropriate Content
Hi Shane,
Thank you so much for your time !!
You have provided lot of details, which I have to work on..I will come back..
- « Previous Replies
-
- 1
- 2
- Next Replies »