Unlock a world of possibilities! Login now and discover the exclusive benefits awaiting you.
- Qlik Community
- :
- All Forums
- :
- QlikView App Dev
- :
- popup text line chart issue
- Subscribe to RSS Feed
- Mark Topic as New
- Mark Topic as Read
- Float this Topic for Current User
- Bookmark
- Subscribe
- Mute
- Printer Friendly Page
- Mark as New
- Bookmark
- Subscribe
- Mute
- Subscribe to RSS Feed
- Permalink
- Report Inappropriate Content
popup text line chart issue
I have an issue with a line chart.
- 2 dimensions : month and category.
- expression 1: sum(measure)
- expression 2 as popup text - (so line checkbox is off and text as pop-up is on).
desired result = see picture
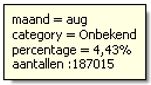
percentage comes from expression 1, aantallen comes fromt expression 2
This result will only show when the popup expression is the first expression in the expression box, otherwise aantallen is not shown.
but...
i want to adjust the colors of the lines in the chart. when i do this with the expression 1 on the second place in the expression box, the object will give an error: Drawing of chart failed internally. when i put in the first position, it will color the lines, but wont show the 'aantallen' in the popup.
remarkeble: when i put the same settings in a bar chart it works fine.
Anybody now a solution, or if this is a known bug?
- Tags:
- line chart
- popup text