Unlock a world of possibilities! Login now and discover the exclusive benefits awaiting you.
- Qlik Community
- :
- All Forums
- :
- QlikView App Dev
- :
- put ranks of expression on x-axis
- Subscribe to RSS Feed
- Mark Topic as New
- Mark Topic as Read
- Float this Topic for Current User
- Bookmark
- Subscribe
- Mute
- Printer Friendly Page
- Mark as New
- Bookmark
- Subscribe
- Mute
- Subscribe to RSS Feed
- Permalink
- Report Inappropriate Content
put ranks of expression on x-axis
Hello
I need to accomplish the following:
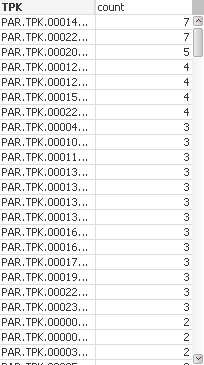
first I have and expression that counts the number of regressions by test (TPK)
my expression is as follows:
count
(DISTINCT
{
<
OFFICIAL=
,ROF_CATEGORY=
,TYPE={'reg'}
,RECORD_TYPE={'detection'}
>
} ID
)
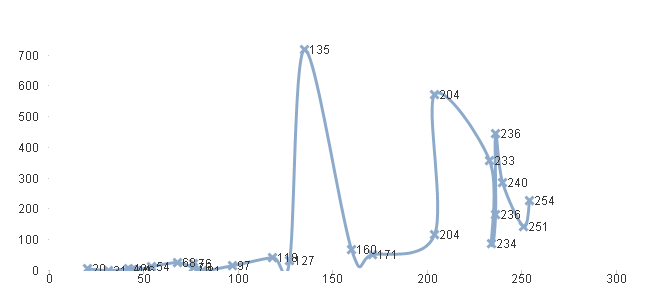
when grouped by TPK I get the following chart:
what I want to accomplish is to have a bar chart where on the x-axis I want to have the following values:1,2,3,4,5,6, etc....
where on 1 i should have 14
on 2 I should have 5
on 3 I should have 16
on 4 I should have 39
etc....
Please advise
- Mark as New
- Bookmark
- Subscribe
- Mute
- Subscribe to RSS Feed
- Permalink
- Report Inappropriate Content
Try putting this in dimension
If(Aggr(count(DISTINCT{<OFFICIAL=,ROF_CATEGORY=,TYPE={'reg'},RECORD_TYPE={'detection'}> } ID), TPK) =1, 14,
If(Aggr(count(DISTINCT{<OFFICIAL=,ROF_CATEGORY=,TYPE={'reg'},RECORD_TYPE={'detection'}> } ID), TPK) =2, 5,
etc....
Thanks,
Vinod Kumar V
- Mark as New
- Bookmark
- Subscribe
- Mute
- Subscribe to RSS Feed
- Permalink
- Report Inappropriate Content
Dear Ali,
Can you attach the sample apps .
Thanks,
Mukram
- Mark as New
- Bookmark
- Subscribe
- Mute
- Subscribe to RSS Feed
- Permalink
- Report Inappropriate Content
I solved it as follows:
in the dimension I put the following:
=AGGR(rank(SUM(AGGR($(vDetection.TotalRegression),TPK)),1),TPK)
but I'm facing a sorting issue I want to sort result in descending order but I'm getting results as follows: