Unlock a world of possibilities! Login now and discover the exclusive benefits awaiting you.
- Qlik Community
- :
- All Forums
- :
- QlikView App Dev
- :
- Re: query on Straight table( to show all dimension...
- Subscribe to RSS Feed
- Mark Topic as New
- Mark Topic as Read
- Float this Topic for Current User
- Bookmark
- Subscribe
- Mute
- Printer Friendly Page
- Mark as New
- Bookmark
- Subscribe
- Mute
- Subscribe to RSS Feed
- Permalink
- Report Inappropriate Content
query on Straight table( to show all dimension irrespective of expression)
Hi,
I am having two tables X & Y.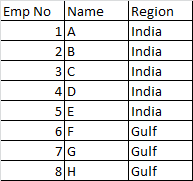
and

I want to display a straight table with Name and Sum(sales) with Region filter as 'India'.
Below displays the required chart. I want to display last row also.

Please Suggest.
Regards,
Joshmi
- Mark as New
- Bookmark
- Subscribe
- Mute
- Subscribe to RSS Feed
- Permalink
- Report Inappropriate Content
For the dimension Tick Show All Values.
On the Presentation tab untick Suppress Zero-Values and Suppress Missing.
- Mark as New
- Bookmark
- Subscribe
- Mute
- Subscribe to RSS Feed
- Permalink
- Report Inappropriate Content
Hi Bill,
Thank You for your Reply.
I have tried the same.
But In this case last row which is having 0 sales is not displaying.
I want to display that row also.
Regards,
Joshmi
- Mark as New
- Bookmark
- Subscribe
- Mute
- Subscribe to RSS Feed
- Permalink
- Report Inappropriate Content
Strange, it seems to work for me,
See attached.
- Mark as New
- Bookmark
- Subscribe
- Mute
- Subscribe to RSS Feed
- Permalink
- Report Inappropriate Content
Here in this pivot table i m having the issue with the Performance Total it is varying .
It should be Sum([Coperate SLP])*[Performance])
Means (103*106)+(0*111)=109.18 but its displaying as 111 that is the problem over here.
Please Help me guys since a week i m striving to get it done but its not getting perfect.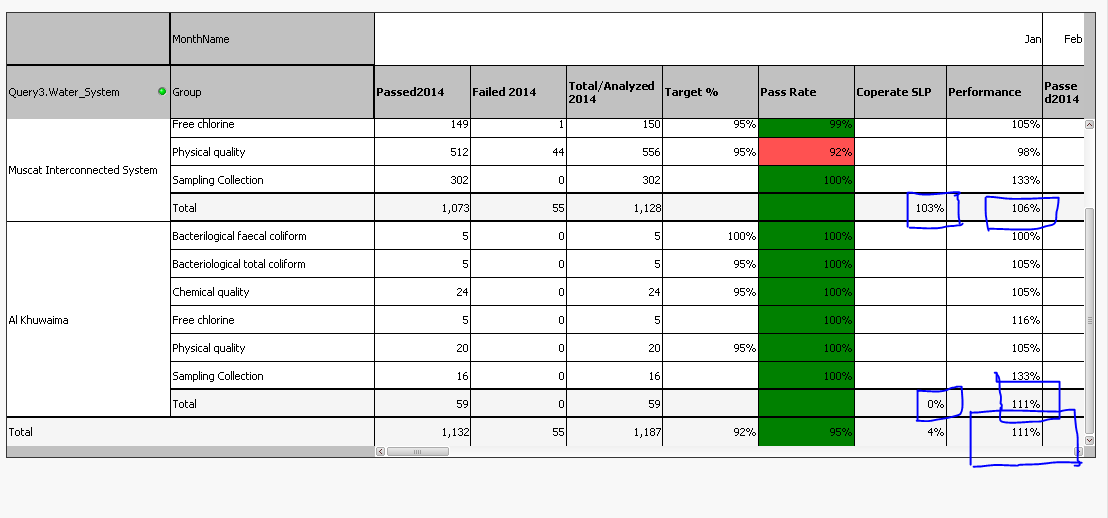
- Mark as New
- Bookmark
- Subscribe
- Mute
- Subscribe to RSS Feed
- Permalink
- Report Inappropriate Content
Hi Bill,
Thank You for Your help. This is working.
Could you check for 1 more scenario.?
if the 2nd table is like below,
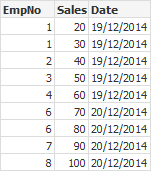
If I am selecting Date: 19/12/2014, I should get the previous Result.
Regards,
Joshmi
- Mark as New
- Bookmark
- Subscribe
- Mute
- Subscribe to RSS Feed
- Permalink
- Report Inappropriate Content
Hi i m having a query in pivot table can u help me ...
- Mark as New
- Bookmark
- Subscribe
- Mute
- Subscribe to RSS Feed
- Permalink
- Report Inappropriate Content
Joshmi
The etiquette is one question per thread.
So for your new question probably best to create a new thread for it.