Unlock a world of possibilities! Login now and discover the exclusive benefits awaiting you.
- Qlik Community
- :
- All Forums
- :
- QlikView App Dev
- :
- rangesum result on a selected year
- Subscribe to RSS Feed
- Mark Topic as New
- Mark Topic as Read
- Float this Topic for Current User
- Bookmark
- Subscribe
- Mute
- Printer Friendly Page
- Mark as New
- Bookmark
- Subscribe
- Mute
- Subscribe to RSS Feed
- Permalink
- Report Inappropriate Content
rangesum result on a selected year
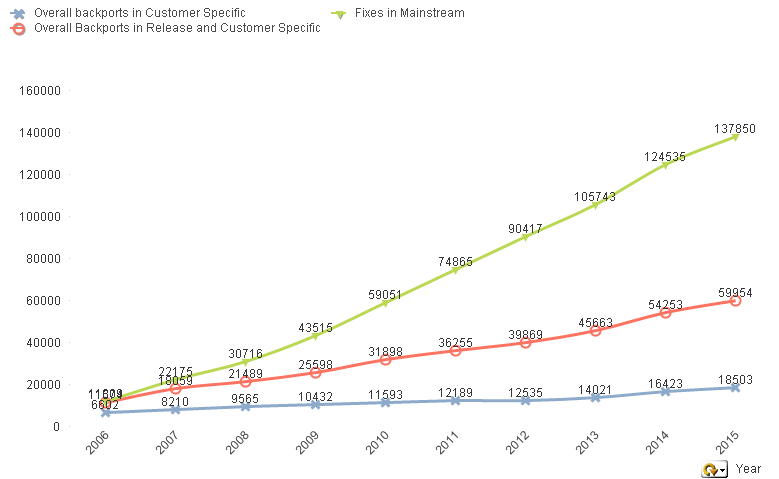
Hello got the following graph

my expression is as follows:
RangeSum(Above( total COUNT(DISTINCT{
1
<
Year=$::Year
,MonthYear=$::MonthYear
,Month=$::Month
,QUARTER_YEAR=$::QUARTER_YEAR
,Quarter=$::Quarter
,FIX_DATE={">=$(vReferenceDate)"}
,RECORD_TYPE={'MAINSTREAM'}
>
} FIX_ID),1,RowNo()))
how can I keep the cumulative result when I select for example 2011 and still get 74865 on the green line above
Please advise
- Mark as New
- Bookmark
- Subscribe
- Mute
- Subscribe to RSS Feed
- Permalink
- Report Inappropriate Content
Try this:
If(Sum({1<Year=$::Year, MonthYear=$::MonthYear, Month=$::Month,QUARTER_YEAR=$::QUARTER_YEAR, Quarter=$::Quarter} FIX_ID) > 0,
RangeSum(Above( total COUNT(DISTINCT{1<Year =, MonthYear = , Month =, QUARTER_YEAR =, Quarter =, FIX_DATE = {">=$(vReferenceDate)"}, RECORD_TYPE={'MAINSTREAM'}>} FIX_ID),1,RowNo())))
- Mark as New
- Bookmark
- Subscribe
- Mute
- Subscribe to RSS Feed
- Permalink
- Report Inappropriate Content
no didn't work ![]()
- Mark as New
- Bookmark
- Subscribe
- Mute
- Subscribe to RSS Feed
- Permalink
- Report Inappropriate Content
What about this:
If(Count(DISTINCT {1<Year=$::Year, MonthYear=$::MonthYear, Month=$::Month,QUARTER_YEAR=$::QUARTER_YEAR, Quarter=$::Quarter, RECORD_TYPE={'MAINSTREAM'}, FIX_DATE = {">=$(vReferenceDate)"}>} FIX_ID) > 0,
RangeSum(Above( total COUNT(DISTINCT{1<Year =, MonthYear = , Month =, QUARTER_YEAR =, Quarter =, FIX_DATE = {">=$(vReferenceDate)"}, RECORD_TYPE={'MAINSTREAM'}>} FIX_ID),1,RowNo())))