Unlock a world of possibilities! Login now and discover the exclusive benefits awaiting you.
- Qlik Community
- :
- All Forums
- :
- QlikView App Dev
- :
- Re: reference line
- Subscribe to RSS Feed
- Mark Topic as New
- Mark Topic as Read
- Float this Topic for Current User
- Bookmark
- Subscribe
- Mute
- Printer Friendly Page
- Mark as New
- Bookmark
- Subscribe
- Mute
- Subscribe to RSS Feed
- Permalink
- Report Inappropriate Content
reference line
Hello there,
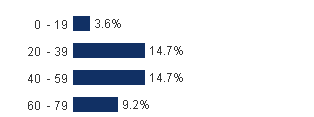
Looking to add a reference line to a horizontal bar chart. Normally this is pretty easy using the presentation tab, reference line, but my dimension causes some issues.
My dimension is a field where the values are a range, '0-19', '20-39', etc. I want to assign a reference line at a particular point, say 40.

- « Previous Replies
-
- 1
- 2
- Next Replies »
- Mark as New
- Bookmark
- Subscribe
- Mute
- Subscribe to RSS Feed
- Permalink
- Report Inappropriate Content
So you don't have a continuous dimension axis?
- Mark as New
- Bookmark
- Subscribe
- Mute
- Subscribe to RSS Feed
- Permalink
- Report Inappropriate Content
May be like:
Change the Axes as Continuous, Now add the reference value in Expression area as 40 and check.
- Mark as New
- Bookmark
- Subscribe
- Mute
- Subscribe to RSS Feed
- Permalink
- Report Inappropriate Content
I suppose I don't since that option is grayed out. The field I am using for the dimension is a string, i.e. 0-29 is a value for the field.
- Mark as New
- Bookmark
- Subscribe
- Mute
- Subscribe to RSS Feed
- Permalink
- Report Inappropriate Content
I have one solution.
This may be not best practice to use combo chart line as reference line, but it may be suitable for this case.
Example application in attachment.
- Mark as New
- Bookmark
- Subscribe
- Mute
- Subscribe to RSS Feed
- Permalink
- Report Inappropriate Content
Where is the point 40 on this discrete axis?
- Mark as New
- Bookmark
- Subscribe
- Mute
- Subscribe to RSS Feed
- Permalink
- Report Inappropriate Content
I am not sure I follow you Marco. The axis is a single field where the values are ranges of 30. What I want to do is draw a line at a fixed point, say 40, that could be drawn over the bars.
- Mark as New
- Bookmark
- Subscribe
- Mute
- Subscribe to RSS Feed
- Permalink
- Report Inappropriate Content
Dear Chase Bushe,
Can you post example of chart (picture in paint or application example) for better understanding, what you wanna to see, because I imagine it as in the picture "Chart example.png" in attachments, but I am not sure, you can do it with QlikView (I may mistake, but i haven`t see such configuration of reference line).
May be colorizing of bar with certain number can solve your problem. (using background color in expression as in attached example).
- Mark as New
- Bookmark
- Subscribe
- Mute
- Subscribe to RSS Feed
- Permalink
- Report Inappropriate Content
Sorry for the delay, work deadlines.
Your Chart Example.png file is exactly what I am hoping to achieve, but given my dimensions are not continuous I am not sure how to accomplish this. I looked at your .qvw but that doesnt show the line, only the background coloring.
- Mark as New
- Bookmark
- Subscribe
- Mute
- Subscribe to RSS Feed
- Permalink
- Report Inappropriate Content
I cant use this approach because the line is vertical. I need the line to be on the same axis as the bars.
- « Previous Replies
-
- 1
- 2
- Next Replies »