Unlock a world of possibilities! Login now and discover the exclusive benefits awaiting you.
Announcements
FLASH SALE: Save $500! Use code FLASH2026 at checkout until Feb 14th at 11:59PM ET. Register Now!
- Qlik Community
- :
- All Forums
- :
- QlikView App Dev
- :
- same value for different kpi
Options
- Subscribe to RSS Feed
- Mark Topic as New
- Mark Topic as Read
- Float this Topic for Current User
- Bookmark
- Subscribe
- Mute
- Printer Friendly Page
Turn on suggestions
Auto-suggest helps you quickly narrow down your search results by suggesting possible matches as you type.
Showing results for
Anonymous
Not applicable
2018-02-12
01:25 AM
- Mark as New
- Bookmark
- Subscribe
- Mute
- Subscribe to RSS Feed
- Permalink
- Report Inappropriate Content
same value for different kpi
Hello everyone,
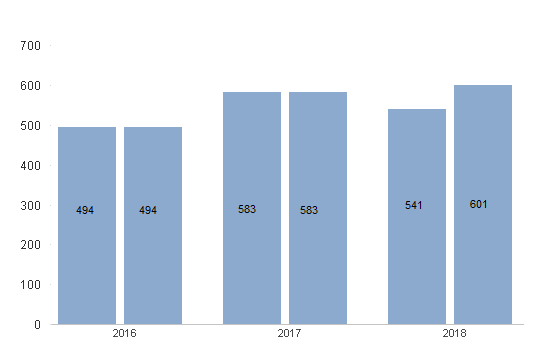
My requirement is to show 3 years data in a bar chart for two different KPI.when i select single KPI then its show for selected one.
My issue is, its show same value for two different KPI in two bars & in first bar it shows exact value.when i select single KPI then its show value for a only single year and when i select both then its show for 3 years but same value for two years.i am not getting where iam stuck please help me to find out.
Thanks..
646 Views
4 Replies
Champion III
2018-02-12
01:37 AM
- Mark as New
- Bookmark
- Subscribe
- Mute
- Subscribe to RSS Feed
- Permalink
- Report Inappropriate Content
Could you share your qvw with sample data to investigate?
571 Views
Anonymous
Not applicable
2018-02-12
01:43 AM
Author
- Mark as New
- Bookmark
- Subscribe
- Mute
- Subscribe to RSS Feed
- Permalink
- Report Inappropriate Content
sorry,i can't share..
571 Views
Champion III
2018-02-12
01:53 AM
- Mark as New
- Bookmark
- Subscribe
- Mute
- Subscribe to RSS Feed
- Permalink
- Report Inappropriate Content
Champion III
2018-02-12
02:01 AM
- Mark as New
- Bookmark
- Subscribe
- Mute
- Subscribe to RSS Feed
- Permalink
- Report Inappropriate Content
Can you share the expressions your are using?
571 Views