Unlock a world of possibilities! Login now and discover the exclusive benefits awaiting you.
- Qlik Community
- :
- All Forums
- :
- QlikView App Dev
- :
- Re: selection on buttons
- Subscribe to RSS Feed
- Mark Topic as New
- Mark Topic as Read
- Float this Topic for Current User
- Bookmark
- Subscribe
- Mute
- Printer Friendly Page
- Mark as New
- Bookmark
- Subscribe
- Mute
- Subscribe to RSS Feed
- Permalink
- Report Inappropriate Content
selection on buttons
Hi All,
Can anybody give me solution for below requirement.
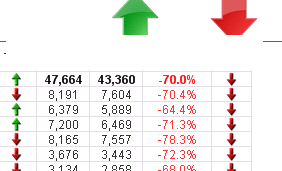
I have one table pivot in that I have implement bullets and also take two images as below.

Now I want when i click green arrow/button it should display only green values and for red it should display red values.
Formula : if([M Gwth %] >0 ,'qmem://<bundled>/BuiltIn/arrow_n_g.png','qmem://<bundled>/BuiltIn/arrow_s_r.png')
2) How to display top 10 value/records in pivot/straight table?
Thanks
- « Previous Replies
-
- 1
- 2
- Next Replies »
- Mark as New
- Bookmark
- Subscribe
- Mute
- Subscribe to RSS Feed
- Permalink
- Report Inappropriate Content
Hi
try dimension limits in straight table .
- Mark as New
- Bookmark
- Subscribe
- Mute
- Subscribe to RSS Feed
- Permalink
- Report Inappropriate Content
Hi,
1. Is [M Gwth %] is calculated or direct field in data model? If it is direct field you can use text box select in field action to get desired result.
2. To display top 10 values you can use Dimension Limit tab in properties.
- Mark as New
- Bookmark
- Subscribe
- Mute
- Subscribe to RSS Feed
- Permalink
- Report Inappropriate Content
Hi,
1.[M Gwth %] is not calculated in Data model it is only calculated in front end.
2. I want display top 10 values in Pivot table
Is there any another way to achieve it.
Thanks
- Mark as New
- Bookmark
- Subscribe
- Mute
- Subscribe to RSS Feed
- Permalink
- Report Inappropriate Content
- Mark as New
- Bookmark
- Subscribe
- Mute
- Subscribe to RSS Feed
- Permalink
- Report Inappropriate Content
Hi
I want display top 10 values in Pivot table :
You can try with Rank() function, for ex:
If(Rank(sum(Sales), 0, 4) <= 10, Sum(Sales))
Now I want when i click green arrow/button it should display only green values and for red it should display red values.
Green and Red arrow are in Text box ?
Please close the thread by marking correct answer & give likes if you like the post.
- Mark as New
- Bookmark
- Subscribe
- Mute
- Subscribe to RSS Feed
- Permalink
- Report Inappropriate Content
Hi,
1)
Create 2 chart one having only green arrow value and another for only red arrow value
create variable say vShow
Create 2 Button on for red and Green Arrow
For Green Arrow Button go to Property ->Action-> Add Action -> External->SetVariable->enter variable Name and set Value 1
then Go to chart Propertu having only Green Arrow Value->Property->Layout->conditional->Write if(vShow=1,1,0)
Do the same thing for another chart also.
Regards
Please appreciate our Qlik community members by giving Kudos for sharing their time for your query. If your query is answered, please mark the topic as resolved 🙂
- Mark as New
- Bookmark
- Subscribe
- Mute
- Subscribe to RSS Feed
- Permalink
- Report Inappropriate Content
Other way you can use is Rank function
- Mark as New
- Bookmark
- Subscribe
- Mute
- Subscribe to RSS Feed
- Permalink
- Report Inappropriate Content
Hi Thanks for reply..
Yes the Green and Red arrow are in Text box and another one are bullets which used in pivot table.
Thanks
- Mark as New
- Bookmark
- Subscribe
- Mute
- Subscribe to RSS Feed
- Permalink
- Report Inappropriate Content
Anybody give some light on this?
- « Previous Replies
-
- 1
- 2
- Next Replies »