Unlock a world of possibilities! Login now and discover the exclusive benefits awaiting you.
- Qlik Community
- :
- All Forums
- :
- QlikView App Dev
- :
- set analysis for date ranges
- Subscribe to RSS Feed
- Mark Topic as New
- Mark Topic as Read
- Float this Topic for Current User
- Bookmark
- Subscribe
- Mute
- Printer Friendly Page
- Mark as New
- Bookmark
- Subscribe
- Mute
- Subscribe to RSS Feed
- Permalink
- Report Inappropriate Content
set analysis for date ranges
Hi,
I am writing a set analysis for data on policy count between some date range but not getting it working. Attached is the screen shot for the set analysis.
The Date function is getting a red underline.
Thanks
Lax
- « Previous Replies
- Next Replies »
- Mark as New
- Bookmark
- Subscribe
- Mute
- Subscribe to RSS Feed
- Permalink
- Report Inappropriate Content
Hi,
I guess this seems to work, but let me validate the data completely. btw why the exp. has changed drastically here. why can't I directly match the years in my set expression instead of writing if condition.
Thanks
Lax
- Mark as New
- Bookmark
- Subscribe
- Mute
- Subscribe to RSS Feed
- Permalink
- Report Inappropriate Content
Hi,
Set analysis compares with the value not directly with the field name.
Celambarasan
- Mark as New
- Bookmark
- Subscribe
- Mute
- Subscribe to RSS Feed
- Permalink
- Report Inappropriate Content
Hi, so there is now way to use the following exp.
=count({<POLICYSTATUS={'Withdrawal'},POLICY_EXIT_DATE=ELIGIBILITY_DATE>}POLICYNUMBER)
Further in the exp.
=Sum(Aggr(if(Year(EXTRACTIONDATE)=Year(ELIGIBILITY_DATE),1,0),POLICYNUMBER)).
How can I add one more filter. For eg. I want this data to be stacked based on field COMMENCEMENT_DATE
Regards
Lax
- Mark as New
- Bookmark
- Subscribe
- Mute
- Subscribe to RSS Feed
- Permalink
- Report Inappropriate Content
Hi,
COMMENCEMENT_DATE ?
Could you describe it little more brief please.
Celambarasan
- Mark as New
- Bookmark
- Subscribe
- Mute
- Subscribe to RSS Feed
- Permalink
- Report Inappropriate Content
Hi, This is again an attribute of policy. Ok lets take POLICYYEAR instead of COMMENCEMENTDATE. For each of the policy there would be POLICYYEAR. We already have ELIGIBILITY_DATE, EXTRACTIONDATE,POLICYSTATUS. Using this attributes , we are now getting the policy count for respective eligible year and extraction date.
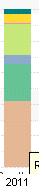
I already have a policy count for the eligible year, in that count I want to bifurgate into commencement year . If the policy count for a year say 2011 is 100 ( got from the expression above) . out of this 100 , 60 are with policyyear 3, 30 are with policyyear 3 and 10 are with policyyear 5. You would have 3 different color in the bar with contribution of
policy count for each of this policy years. Something similar like below image.
Thanks
Lax
- Mark as New
- Bookmark
- Subscribe
- Mute
- Subscribe to RSS Feed
- Permalink
- Report Inappropriate Content
Hi,
Adding PolicyYear as another dimension didn't solve your problem?
Celambarasan
- « Previous Replies
- Next Replies »