Unlock a world of possibilities! Login now and discover the exclusive benefits awaiting you.
- Qlik Community
- :
- All Forums
- :
- QlikView App Dev
- :
- Re: set expression with condition
- Subscribe to RSS Feed
- Mark Topic as New
- Mark Topic as Read
- Float this Topic for Current User
- Bookmark
- Subscribe
- Mute
- Printer Friendly Page
- Mark as New
- Bookmark
- Subscribe
- Mute
- Subscribe to RSS Feed
- Permalink
- Report Inappropriate Content
set expression with condition
hello everyone,
i have monthly data from 2009 to 2017 and yearly,monthly,quarterly (YMQ)data for 2018 & 2019 and yearly data for 2020 to 2022.
my requirement is to show monthly data for 2009 to 2017 & Yearly data for 2018 to 2022.
but the issue is when i select year 2020 it shows addition of YMQ for 2019 & & so on.
PFA for the same.
Thanks.
Accepted Solutions
- Mark as New
- Bookmark
- Subscribe
- Mute
- Subscribe to RSS Feed
- Permalink
- Report Inappropriate Content
Try these expressions
=If(Only({1} YEAR) >= 2018,
Sum({<REGION = {'INDIA'}, GRANULARITY = {'YEARLY'}, YEAR = {">=$(var_yearstart)<=$(=var_yearend)"}>}VALUE),
Sum({<REGION = {'INDIA'}, YEAR = {">=$(var_yearstart)<=$(=var_yearend)"}>} VALUE))
=If(Only({1} YEAR) >= 2018,
Sum({<REGION = {'US'}, GRANULARITY = {'YEARLY'}, YEAR = {">=$(var_yearstart)<=$(=var_yearend)"}>} VALUE),
Sum({<REGION = {'US'}, YEAR = {">=$(var_yearstart)<=$(=var_yearend)"}>} VALUE))
- Mark as New
- Bookmark
- Subscribe
- Mute
- Subscribe to RSS Feed
- Permalink
- Report Inappropriate Content
but the issue is when i select year 2020 it shows addition of YMQ for 2019 & & so on.
Not sure I understand this? What do you mean?
- Mark as New
- Bookmark
- Subscribe
- Mute
- Subscribe to RSS Feed
- Permalink
- Report Inappropriate Content
Year 18 have QUARTER & YEARLY granularity & 19 have QUARTER,MONTHLY,YEARLY granularity
Year 2009 to 2017 have MONTHLY granularity & 2020 to 2022 have YEARLY granularity.
My requirement is, i want to show MONTHLY granularity for 2009 to 2017 & YEARLY granularity for 2018 to 2022
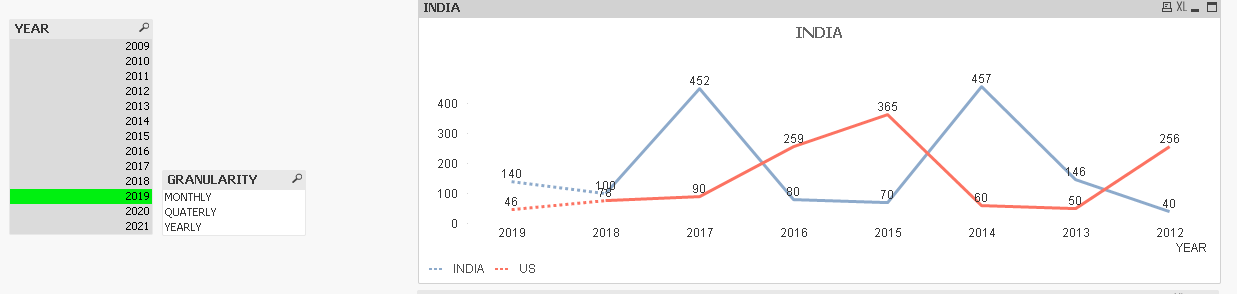
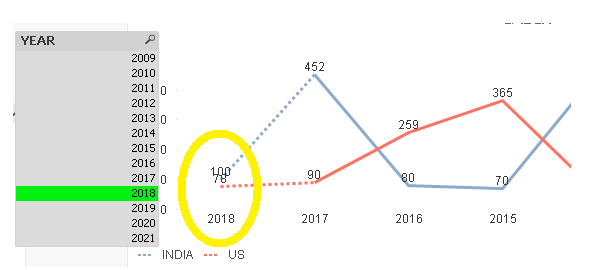
chart show exactly as above (No year selection) but when i select year 2019 then it show exact(means Yearly value for 2019) but notice on year 2018 it shows addition of YEARLY,MONTHLY,QUARTERLY granularity value
When select 2018
When select 2019

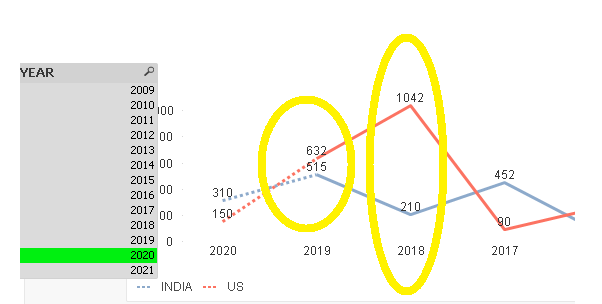
When select 2020
- Mark as New
- Bookmark
- Subscribe
- Mute
- Subscribe to RSS Feed
- Permalink
- Report Inappropriate Content
Try these expressions
=If(Only({1} YEAR) >= 2018,
Sum({<REGION = {'INDIA'}, GRANULARITY = {'YEARLY'}, YEAR = {">=$(var_yearstart)<=$(=var_yearend)"}>}VALUE),
Sum({<REGION = {'INDIA'}, YEAR = {">=$(var_yearstart)<=$(=var_yearend)"}>} VALUE))
=If(Only({1} YEAR) >= 2018,
Sum({<REGION = {'US'}, GRANULARITY = {'YEARLY'}, YEAR = {">=$(var_yearstart)<=$(=var_yearend)"}>} VALUE),
Sum({<REGION = {'US'}, YEAR = {">=$(var_yearstart)<=$(=var_yearend)"}>} VALUE))
- Mark as New
- Bookmark
- Subscribe
- Mute
- Subscribe to RSS Feed
- Permalink
- Report Inappropriate Content
Hi sunny ,
Expression is working fine.but projection line(dotted line) is not showing for 3 years at a time. when i sort year as ascending order then projection not shown & when i sort as a descending then its shows only for selected year(My requirement is to show for 3 years even when i select single year).
it is possible or not?
- Mark as New
- Bookmark
- Subscribe
- Mute
- Subscribe to RSS Feed
- Permalink
- Report Inappropriate Content
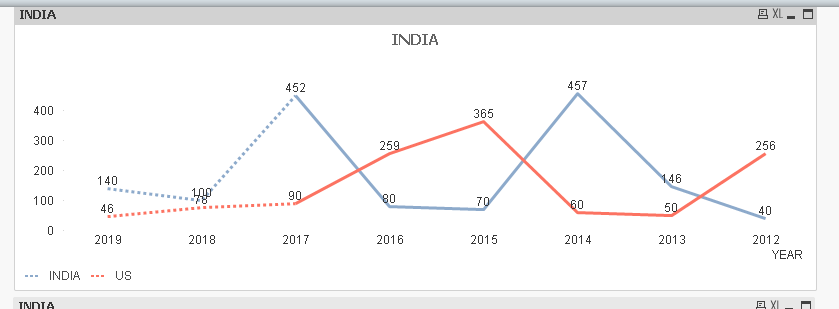
Does this look like what you wanted?
- Mark as New
- Bookmark
- Subscribe
- Mute
- Subscribe to RSS Feed
- Permalink
- Report Inappropriate Content
sorry but i am not able to open file.please share a screen shot.
- Mark as New
- Bookmark
- Subscribe
- Mute
- Subscribe to RSS Feed
- Permalink
- Report Inappropriate Content
What screenshot are you talking about? The above screenshot is not good?
- Mark as New
- Bookmark
- Subscribe
- Mute
- Subscribe to RSS Feed
- Permalink
- Report Inappropriate Content
i was talking about help1 file. but its ok. i took permission to open help1 file in development server.
BTW, Thank you so much.