Unlock a world of possibilities! Login now and discover the exclusive benefits awaiting you.
- Qlik Community
- :
- All Forums
- :
- QlikView App Dev
- :
- show all values in x-axis
- Subscribe to RSS Feed
- Mark Topic as New
- Mark Topic as Read
- Float this Topic for Current User
- Bookmark
- Subscribe
- Mute
- Printer Friendly Page
- Mark as New
- Bookmark
- Subscribe
- Mute
- Subscribe to RSS Feed
- Permalink
- Report Inappropriate Content
show all values in x-axis
Hi,
Is it possible to always show all values in x-axis, even if data are missing? See attachment. 2013 P02 data are missing, but I want to show 2013 P02 in the chart.
Thank you for your answer.
- Mark as New
- Bookmark
- Subscribe
- Mute
- Subscribe to RSS Feed
- Permalink
- Report Inappropriate Content
uncheck the box suppress zero values
- Mark as New
- Bookmark
- Subscribe
- Mute
- Subscribe to RSS Feed
- Permalink
- Report Inappropriate Content
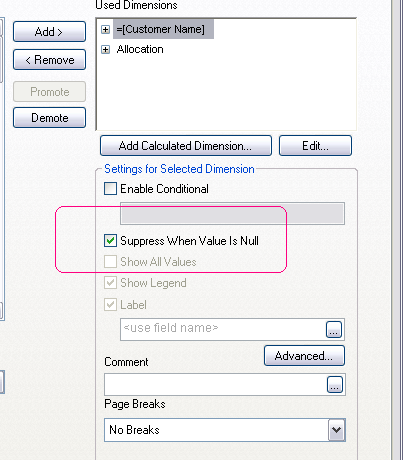
Go to Dimension Tab and Untick Suppress When Value is NULL
- Mark as New
- Bookmark
- Subscribe
- Mute
- Subscribe to RSS Feed
- Permalink
- Report Inappropriate Content
 Hi,
Hi,
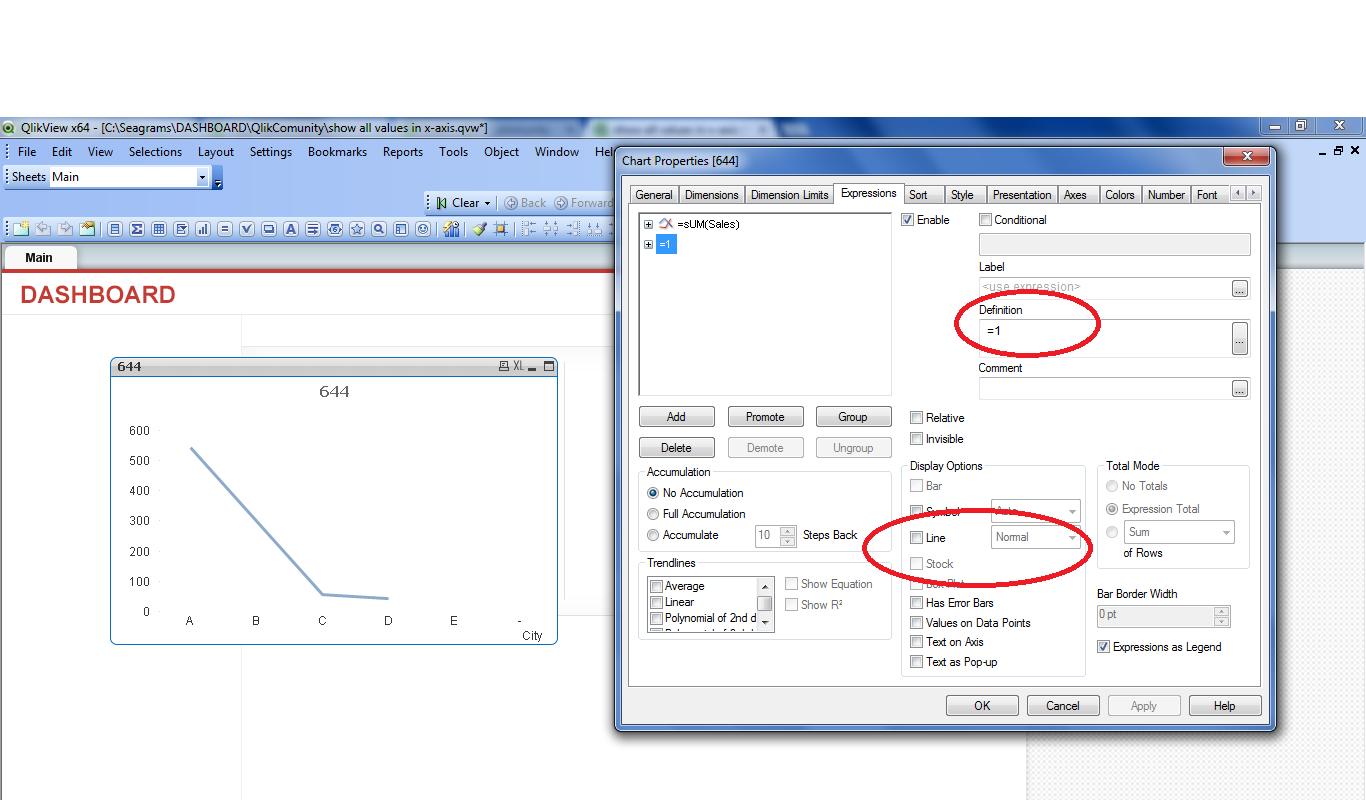
Add one more expression, write =1 in new expression.
and then uncheck the Line option under the Display Options for this expression only
- Mark as New
- Bookmark
- Subscribe
- Mute
- Subscribe to RSS Feed
- Permalink
- Report Inappropriate Content
@@
Yes it works, but what if I want to show all periods in x-axis and I have data only from 2013 P05 (see attachment). I want to show also 2013 P04, 2013 P05 etc. Is it possible ?
- Mark as New
- Bookmark
- Subscribe
- Mute
- Subscribe to RSS Feed
- Permalink
- Report Inappropriate Content
My idea is to do something like this (see attachment). Is it possible?
- Mark as New
- Bookmark
- Subscribe
- Mute
- Subscribe to RSS Feed
- Permalink
- Report Inappropriate Content
I mean something like this (see attachement)
- Mark as New
- Bookmark
- Subscribe
- Mute
- Subscribe to RSS Feed
- Permalink
- Report Inappropriate Content
Hi,
Change background color as white for above values of the dimension will be good idea might be.
Hope this helps
Thanks & Regards