Unlock a world of possibilities! Login now and discover the exclusive benefits awaiting you.
- Qlik Community
- :
- All Forums
- :
- QlikView App Dev
- :
- show when 2 or 3 conditions are not null
- Subscribe to RSS Feed
- Mark Topic as New
- Mark Topic as Read
- Float this Topic for Current User
- Bookmark
- Subscribe
- Mute
- Printer Friendly Page
- Mark as New
- Bookmark
- Subscribe
- Mute
- Subscribe to RSS Feed
- Permalink
- Report Inappropriate Content
show when 2 or 3 conditions are not null
I have a table
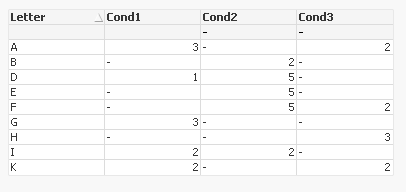
and I would like to show only rows where 2 or 3 of the columns are not null (in other words to exclude rows with 2 or more null)
so expecting to see:
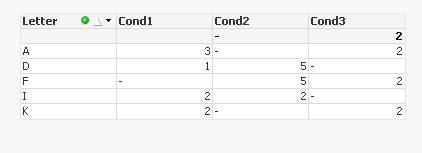
Any nice way of achieving this?
Raphael
Accepted Solutions
- Mark as New
- Bookmark
- Subscribe
- Mute
- Subscribe to RSS Feed
- Permalink
- Report Inappropriate Content
Hi,
I can't open your document because i'am on personnal edition right now.
But i have create a small sample (four first rows of your example).
So, use in your load statement the flag wchich count the number of missing value:
RangeSum(if(Condition1='',1),if(Condition2='',1), if(Condition3='',1)) as flag
And in your chart, filter the dimension with :
=if(flag=1 or flag=0,Letter,'')
Regards
- Mark as New
- Bookmark
- Subscribe
- Mute
- Subscribe to RSS Feed
- Permalink
- Report Inappropriate Content
Thanks
- Mark as New
- Bookmark
- Subscribe
- Mute
- Subscribe to RSS Feed
- Permalink
- Report Inappropriate Content
You can also do this in the front end
=If(RangeSum(If(Len(Trim(Cond1)) = 0, 1), If(Len(Trim(Cond2)) = 0, 1), If(Len(Trim(Cond3)) = 0, 1)) < 2, Cond1)
=If(RangeSum(If(Len(Trim(Cond1)) = 0, 1), If(Len(Trim(Cond2)) = 0, 1), If(Len(Trim(Cond3)) = 0, 1)) < 2, Cond2)
=If(RangeSum(If(Len(Trim(Cond1)) = 0, 1), If(Len(Trim(Cond2)) = 0, 1), If(Len(Trim(Cond3)) = 0, 1)) < 2, Cond3)
- Mark as New
- Bookmark
- Subscribe
- Mute
- Subscribe to RSS Feed
- Permalink
- Report Inappropriate Content
Thank you Sunny.
At the end I did:
=if(isnull(Cond1)+isnull(Cond2)+isnull(Cond3)>=-1,Cond1)
=if(isnull(Cond1)+isnull(Cond2)+isnull(Cond3)>=-1,Cond2)
=if(isnull(Cond1)+isnull(Cond2)+isnull(Cond3)>=-1,Cond3)