Unlock a world of possibilities! Login now and discover the exclusive benefits awaiting you.
- Qlik Community
- :
- All Forums
- :
- QlikView App Dev
- :
- showing 2 dimensions in the X-axis
- Subscribe to RSS Feed
- Mark Topic as New
- Mark Topic as Read
- Float this Topic for Current User
- Bookmark
- Subscribe
- Mute
- Printer Friendly Page
- Mark as New
- Bookmark
- Subscribe
- Mute
- Subscribe to RSS Feed
- Permalink
- Report Inappropriate Content
showing 2 dimensions in the X-axis
Hi guys,
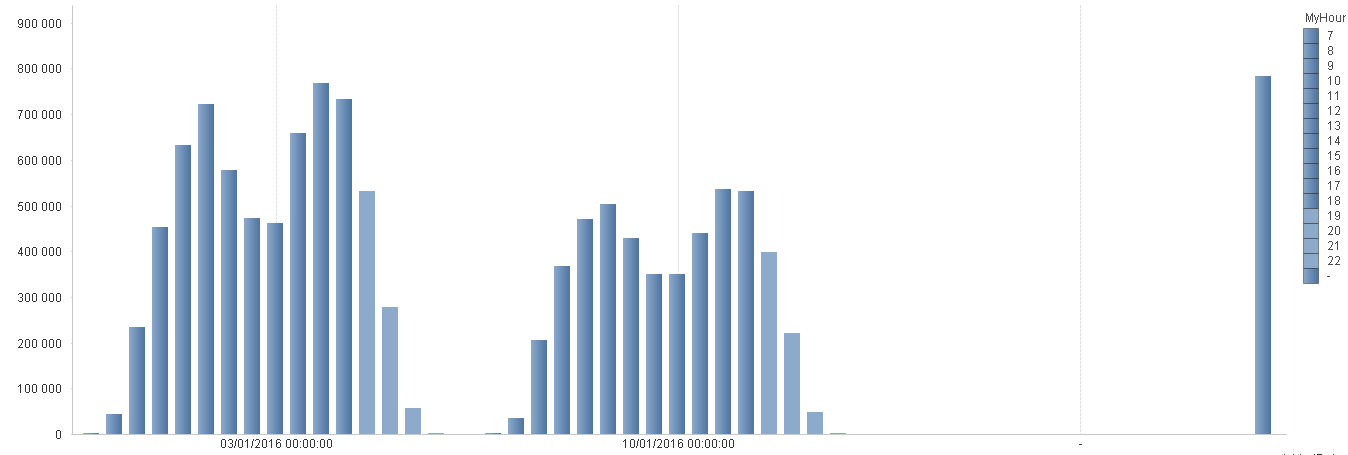
My question is simple, how can I show the dimension 'day' and 'hour' in the same x-axis?
This what I currently have:
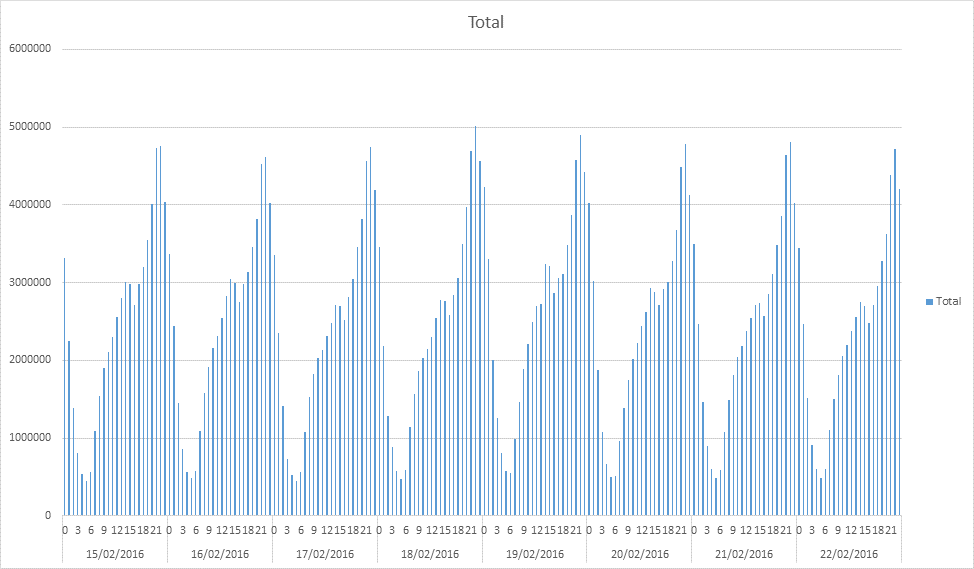
and this what I want to have :
Thank you all
- Tags:
- new_to_qlikview
Accepted Solutions
- Mark as New
- Bookmark
- Subscribe
- Mute
- Subscribe to RSS Feed
- Permalink
- Report Inappropriate Content
- Mark as New
- Bookmark
- Subscribe
- Mute
- Subscribe to RSS Feed
- Permalink
- Report Inappropriate Content
Try creating a third dimension
='Total'
- Mark as New
- Bookmark
- Subscribe
- Mute
- Subscribe to RSS Feed
- Permalink
- Report Inappropriate Content
Hi swuehl,
That went really good when I'm working with bars; but when I try to change it to a linear graph, I have the following nonsense showing up :
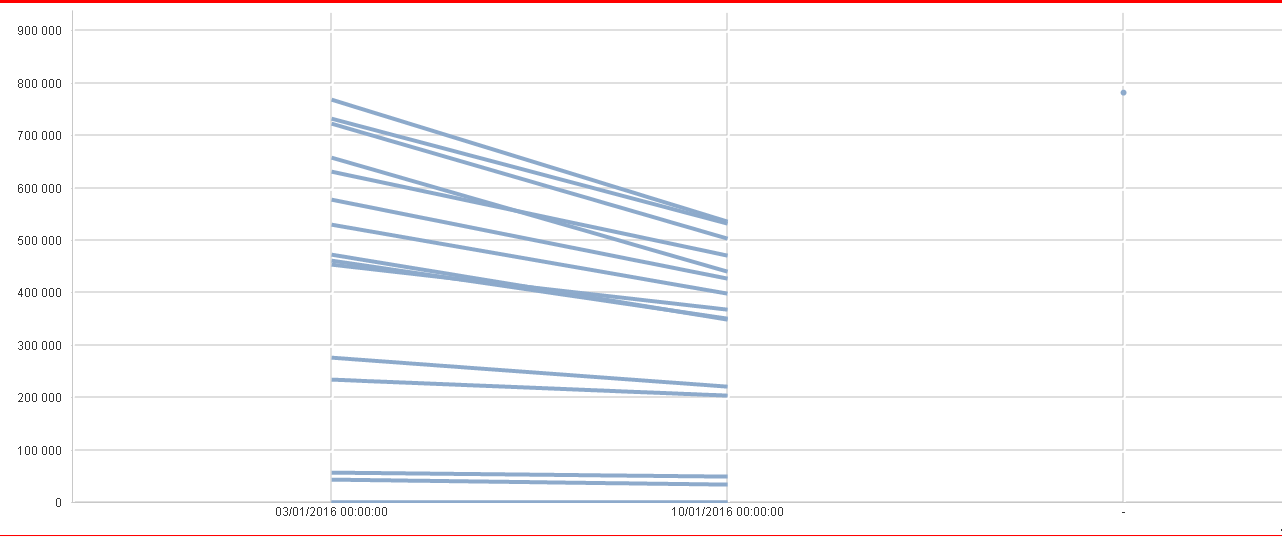
Do you have any idea how to have an accurate linear graph with 2 dimensions like this:
Thank you !
- Mark as New
- Bookmark
- Subscribe
- Mute
- Subscribe to RSS Feed
- Permalink
- Report Inappropriate Content
Hi,
With the existing two dimensions, try to use one more additional expression as '0'.
This will create the secondary dimension automatically.
Thanks,
Vignesh U.
- Mark as New
- Bookmark
- Subscribe
- Mute
- Subscribe to RSS Feed
- Permalink
- Report Inappropriate Content
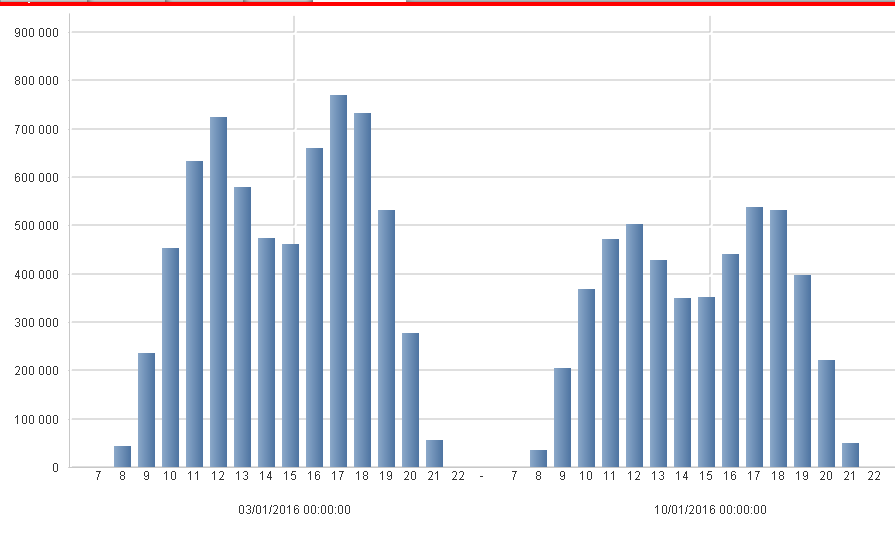
But then, i would have somthing like this when I try to use linear graphs:
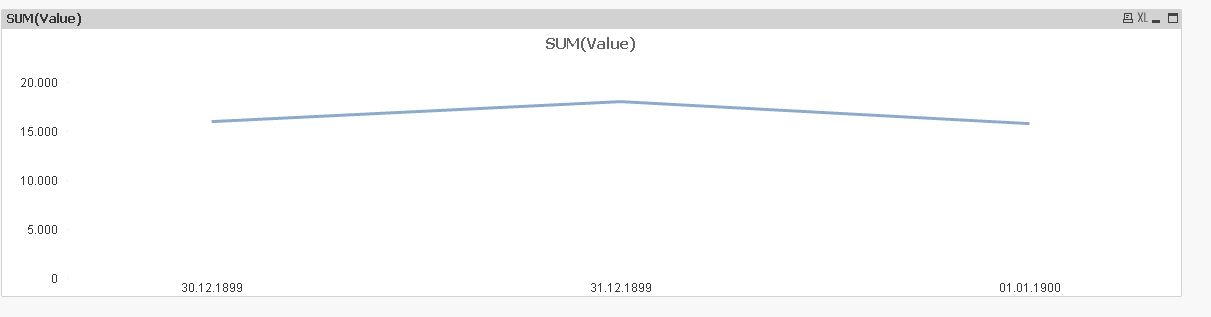
I do not have the hours shown above of the day anymore which is the essential point
- Mark as New
- Bookmark
- Subscribe
- Mute
- Subscribe to RSS Feed
- Permalink
- Report Inappropriate Content
what I want to have is the same thing as with the bar graph;
the days, above them the hours and linar curves that show the sum(value) in each hour (instead of bars, with linear curves graph)