Unlock a world of possibilities! Login now and discover the exclusive benefits awaiting you.
- Qlik Community
- :
- All Forums
- :
- QlikView App Dev
- :
- Re: simple if/then display wanted
- Subscribe to RSS Feed
- Mark Topic as New
- Mark Topic as Read
- Float this Topic for Current User
- Bookmark
- Subscribe
- Mute
- Printer Friendly Page
- Mark as New
- Bookmark
- Subscribe
- Mute
- Subscribe to RSS Feed
- Permalink
- Report Inappropriate Content
simple if/then display wanted
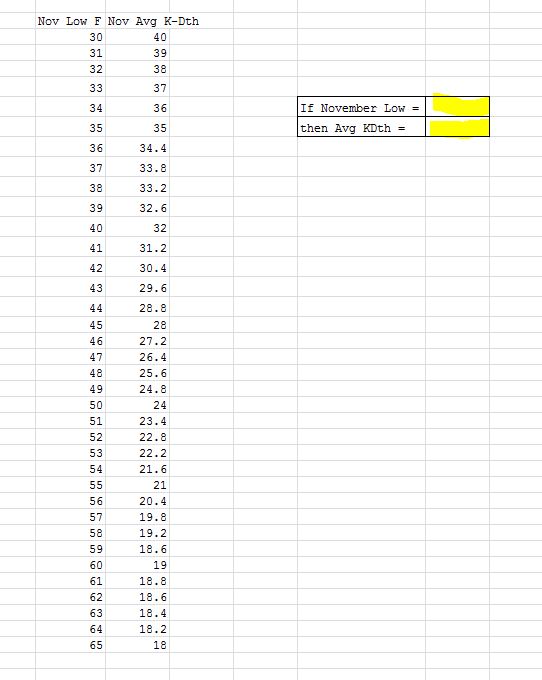
How can I create an if/then query/answer so that when I put in a low temp it find's the historical average load associated with that low temp. In excel I have charted the trend for each winter month and found the corresponding average load delivered to the specified area tied to each low temp. In addition to displaying the graph/table in QV (this I know how to do) I want a simple querie box with a place where the low temp can be entered and the corresponding load for that specific low temp pops up next to it. I think this will be an input box but not sure (I'm still in the learning process). I have already loaded in the data (inline) and can make pivot table as well as list boxes for the low temps and the avg loads for each month. My main computer experience has been in excel and am new to QV and so am stumbling with understanding of best way to get this result.
- Mark as New
- Bookmark
- Subscribe
- Mute
- Subscribe to RSS Feed
- Permalink
- Report Inappropriate Content
can you please create a sample app and attach to this thread. This will help you get quick answers.
- Mark as New
- Bookmark
- Subscribe
- Mute
- Subscribe to RSS Feed
- Permalink
- Report Inappropriate Content
Hello,
There is no much difference if you are trying to implement the IF/then from Excel to Qlikview.
1) you can wirte a if statement in Script page and use it further. if(column1>column2,Column3,column3) as new_column
2) you can write the same in Dimension/expression too - if(column1>column2,Column3,column3)
Hope it helps!!
Thanks,
suresh
- Mark as New
- Bookmark
- Subscribe
- Mute
- Subscribe to RSS Feed
- Permalink
- Report Inappropriate Content
 I want just the small box to show like the one I've created here on this excel sheet. I
- Mark as New
- Bookmark
- Subscribe
- Mute
- Subscribe to RSS Feed
- Permalink
- Report Inappropriate Content
it's the same - if(Nov_Low_F=*,avg)
Thanks
- Mark as New
- Bookmark
- Subscribe
- Mute
- Subscribe to RSS Feed
- Permalink
- Report Inappropriate Content
thank you - I'll give it a go
- Mark as New
- Bookmark
- Subscribe
- Mute
- Subscribe to RSS Feed
- Permalink
- Report Inappropriate Content
I have attached an example of how you can accomplish this. I hope it helps!
- Mark as New
- Bookmark
- Subscribe
- Mute
- Subscribe to RSS Feed
- Permalink
- Report Inappropriate Content
1. Us a "Mapping Load...." command on your excel table in Qlikview to create an inline table HISTORICALTEMPS.
2. Then use this statement in you table ApplyMap ('HISTORICALTEMPS', Nov_Low_F).
E.g. ApplyMap ('HISTORICALTEMPS', 52) returns 22.8