Unlock a world of possibilities! Login now and discover the exclusive benefits awaiting you.
- Qlik Community
- :
- All Forums
- :
- QlikView App Dev
- :
- simple line chart
- Subscribe to RSS Feed
- Mark Topic as New
- Mark Topic as Read
- Float this Topic for Current User
- Bookmark
- Subscribe
- Mute
- Printer Friendly Page
- Mark as New
- Bookmark
- Subscribe
- Mute
- Subscribe to RSS Feed
- Permalink
- Report Inappropriate Content
simple line chart
Hi ,
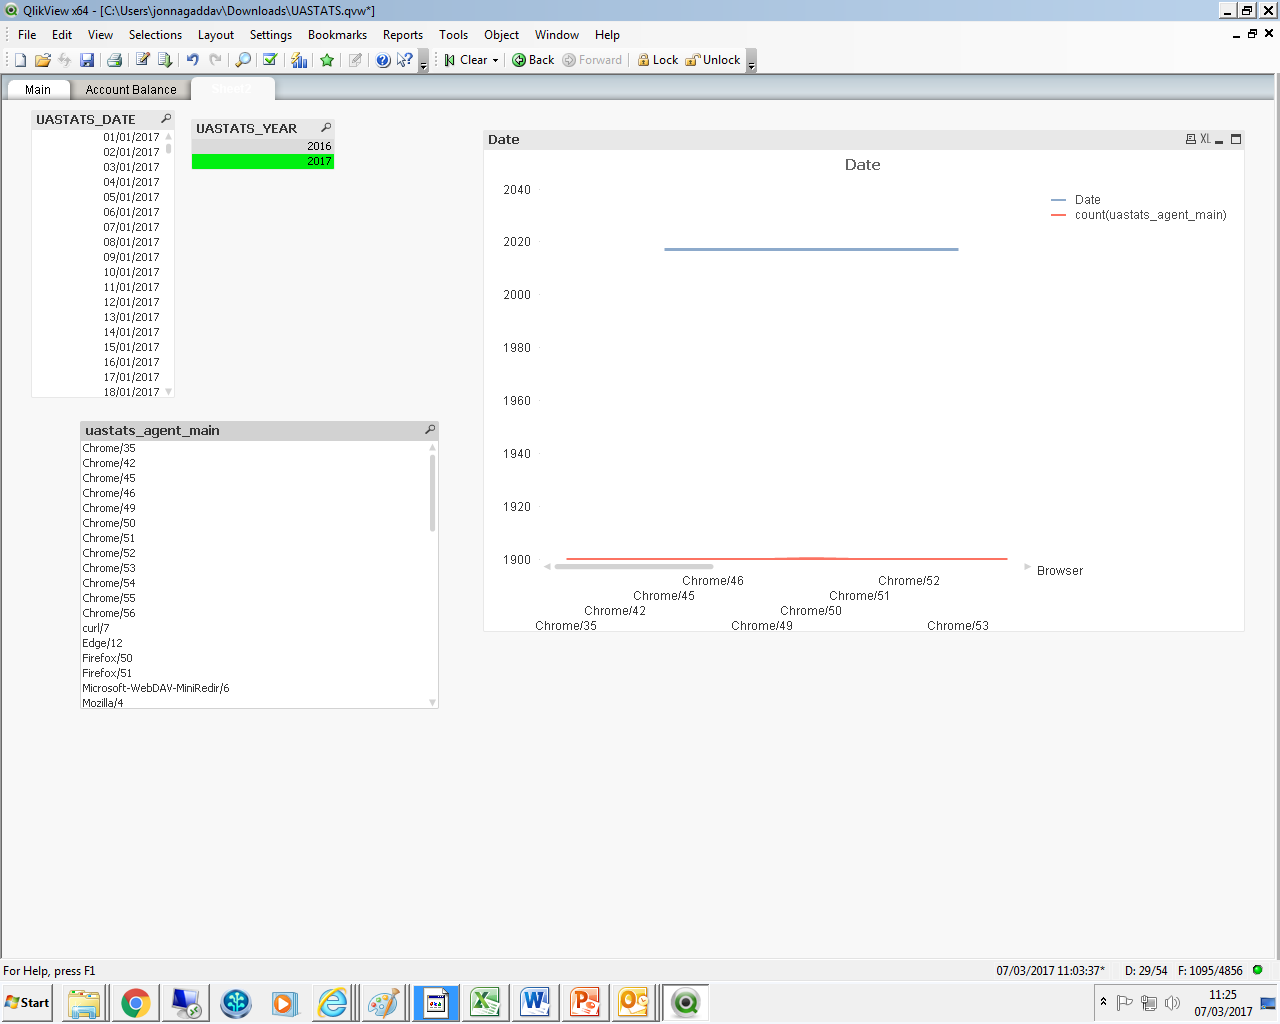
I want to produce a line chart with the dimensions Time and Browser over the period.
I am unable to get these.
What am i doing wrong.
Any help pls.
- Mark as New
- Bookmark
- Subscribe
- Mute
- Subscribe to RSS Feed
- Permalink
- Report Inappropriate Content
hey could you elaborate a little??..like..What do you need to show?.. what expression have you used?
- Mark as New
- Bookmark
- Subscribe
- Mute
- Subscribe to RSS Feed
- Permalink
- Report Inappropriate Content
Hi,
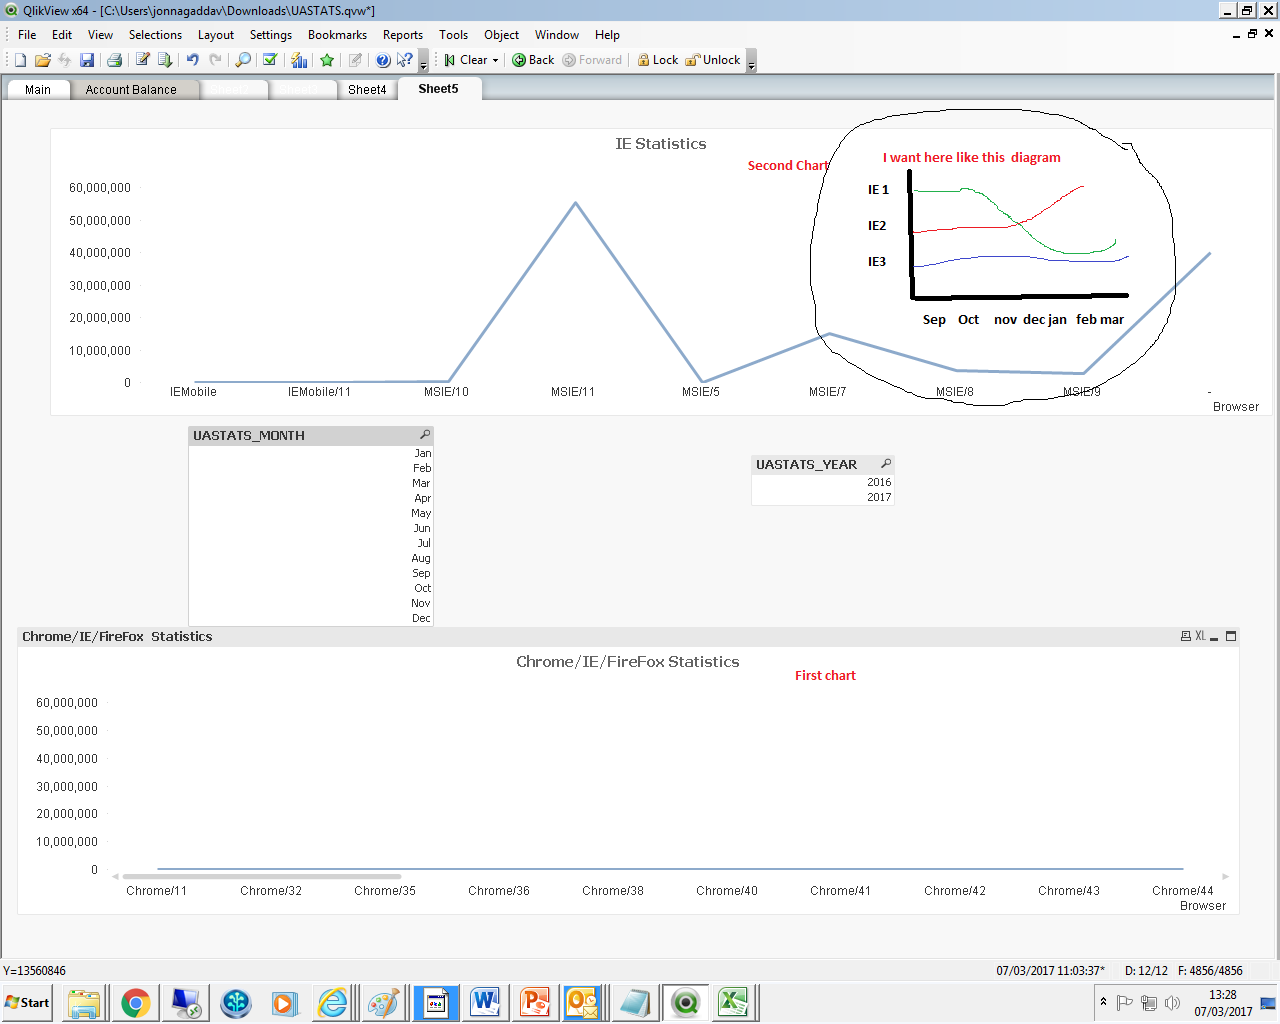
I need to produce 2 line charts with the small variation.
First Line chart : on the x axis i want the dimension Time for the last 6 months and y axis i want the browser only chrome,firefox and IE to display over the time.
Second chart : on the x axis I want the dimension Time for the last 6 months and Y axis I want only the IE Browser with different versions.
Probably the expression i am thinking sum of the browsers over the time.
- Mark as New
- Bookmark
- Subscribe
- Mute
- Subscribe to RSS Feed
- Permalink
- Report Inappropriate Content
If you share your application we can probably help, the requirement seems simple enough but without knowing what is going on its hard to advise.
- Mark as New
- Bookmark
- Subscribe
- Mute
- Subscribe to RSS Feed
- Permalink
- Report Inappropriate Content
Ok
thanks.
My requirement is to show 2 charts
One Line chart having time on x axis for the last 6 months (sep to march) that should show Chrome,IE and firefox
Other line chart having time on xaxis for the last 6 months (sep to march) that should show only IE. versions in our example i didnt create many so thats fine .
I will incorporate the same logic if you can help me pls.