Unlock a world of possibilities! Login now and discover the exclusive benefits awaiting you.
- Qlik Community
- :
- All Forums
- :
- QlikView App Dev
- :
- split axis values
Options
- Subscribe to RSS Feed
- Mark Topic as New
- Mark Topic as Read
- Float this Topic for Current User
- Bookmark
- Subscribe
- Mute
- Printer Friendly Page
Turn on suggestions
Auto-suggest helps you quickly narrow down your search results by suggesting possible matches as you type.
Showing results for
Not applicable
2013-02-08
04:03 AM
- Mark as New
- Bookmark
- Subscribe
- Mute
- Subscribe to RSS Feed
- Permalink
- Report Inappropriate Content
split axis values
Hello!
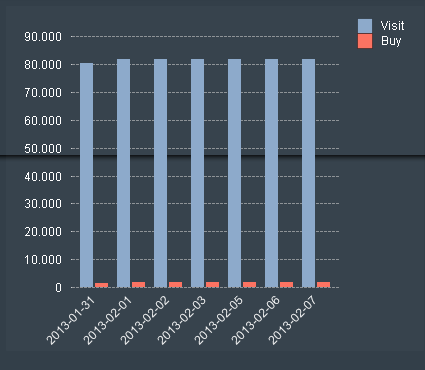
I have this graph above.
Is there any way i can split the Y axis into different values? So for an example i can see values from 1-5000 and then it starts with ex 30000-80000.
1,014 Views
2 Replies
Master II
2013-02-08
04:12 AM
- Mark as New
- Bookmark
- Subscribe
- Mute
- Subscribe to RSS Feed
- Permalink
- Report Inappropriate Content
hiiiii
in properties --> axis tab, there you check on split axis and put value in static min, static max and step
hope it helps
Not applicable
2013-02-08
04:22 AM
Author
- Mark as New
- Bookmark
- Subscribe
- Mute
- Subscribe to RSS Feed
- Permalink
- Report Inappropriate Content
that helped me a bit. but how would i actually do it so it makes sense?
713 Views