Unlock a world of possibilities! Login now and discover the exclusive benefits awaiting you.
- Qlik Community
- :
- All Forums
- :
- QlikView App Dev
- :
- stacked bar chart
- Subscribe to RSS Feed
- Mark Topic as New
- Mark Topic as Read
- Float this Topic for Current User
- Bookmark
- Subscribe
- Mute
- Printer Friendly Page
- Mark as New
- Bookmark
- Subscribe
- Mute
- Subscribe to RSS Feed
- Permalink
- Report Inappropriate Content
stacked bar chart
Hi Qlikss
I have a stacked bar chart with 2 expressions. and text on axes for both axes.
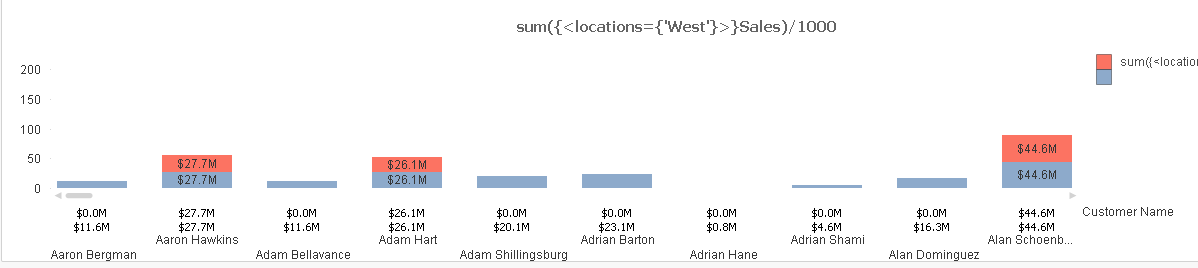
But i want grid lines around those values. like in straight or pivot table. Is it possible.
grid lines around those values. Is this possible
- « Previous Replies
-
- 1
- 2
- Next Replies »
- Mark as New
- Bookmark
- Subscribe
- Mute
- Subscribe to RSS Feed
- Permalink
- Report Inappropriate Content
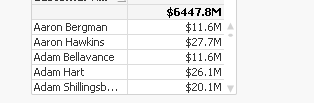
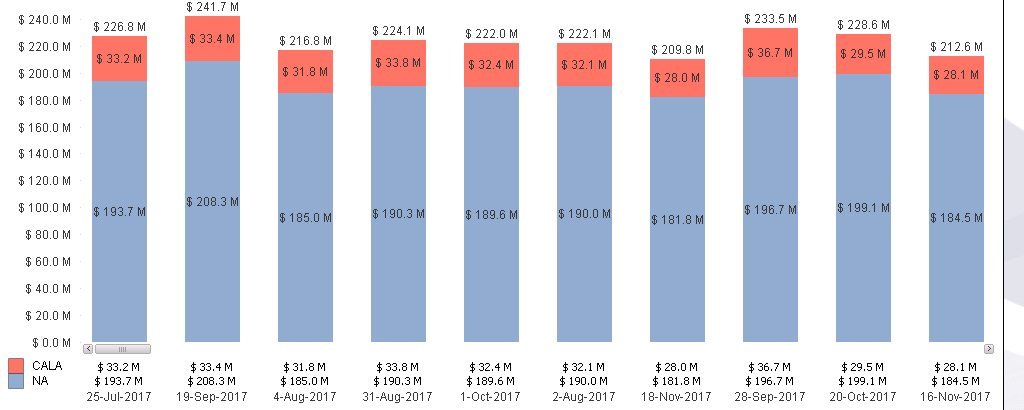
i want grid grid lines for text on axis like second image
- Mark as New
- Bookmark
- Subscribe
- Mute
- Subscribe to RSS Feed
- Permalink
- Report Inappropriate Content
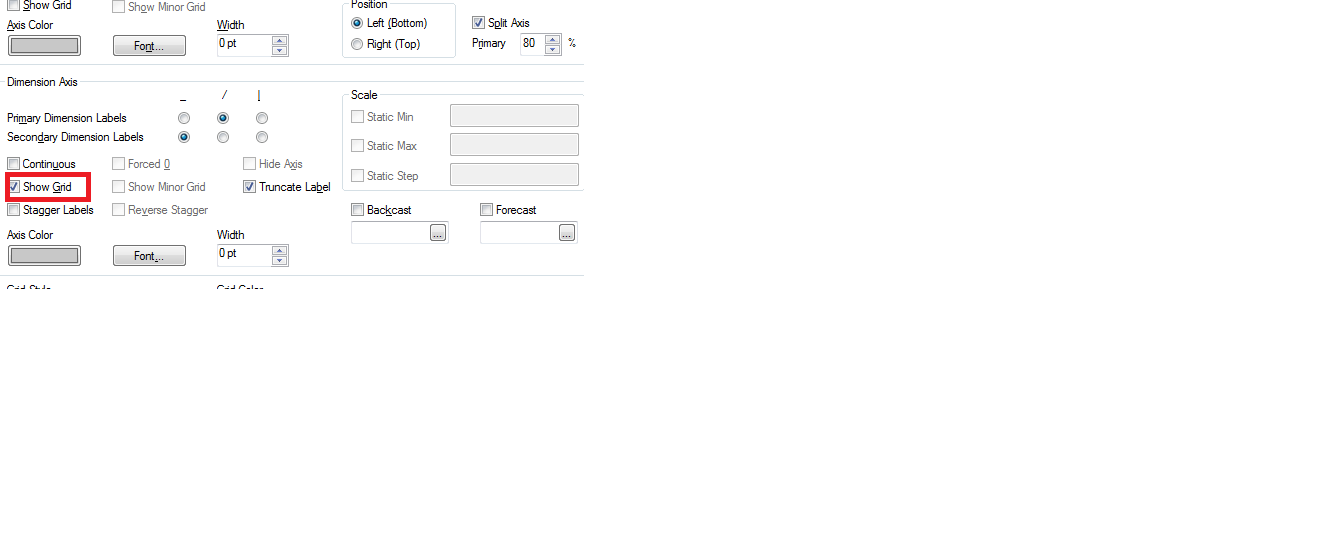
Have you tried Show Grid option
Go to the properties >> Axis >> Show Grid
- Mark as New
- Bookmark
- Subscribe
- Mute
- Subscribe to RSS Feed
- Permalink
- Report Inappropriate Content
Not sure, Where and Which grid you are talking about? If you look Axes Tab there is Grid option already build up in software. If not, There is one more section there you need to increase from 0 pt to 1 pt to get it work.
If you are talking about Last Row which shows names there you need to place either Slider object / Simple Line and Arrow object using work around you can elapse the width from 100% to needed..
- Mark as New
- Bookmark
- Subscribe
- Mute
- Subscribe to RSS Feed
- Permalink
- Report Inappropriate Content
hi Anil,
i want border lines for text on axis values. i want these values in box. like second screenshot
$0.0M
$11.6M
i want border lines around these values. Second screenshot is just for understanding
- Mark as New
- Bookmark
- Subscribe
- Mute
- Subscribe to RSS Feed
- Permalink
- Report Inappropriate Content
it's not grid lines in charts.
i need border lines around text on axes values.
- Mark as New
- Bookmark
- Subscribe
- Mute
- Subscribe to RSS Feed
- Permalink
- Report Inappropriate Content
Even, this future existing. If you check "Advanced Mode" from "Style" and then if you go Layout option from report properties you will get some style options to call "Border 1 PX" then you will achieve it. Are you going to have same thing like my explanation? If not,
Another approach, Like i mentioned above there is some Grip Appearance section from Axes tab only called "Axes Color" from that row there is Width you need to extend to 1PX to get it to work the same using expression axis too
- Mark as New
- Bookmark
- Subscribe
- Mute
- Subscribe to RSS Feed
- Permalink
- Report Inappropriate Content
Hi Anil,
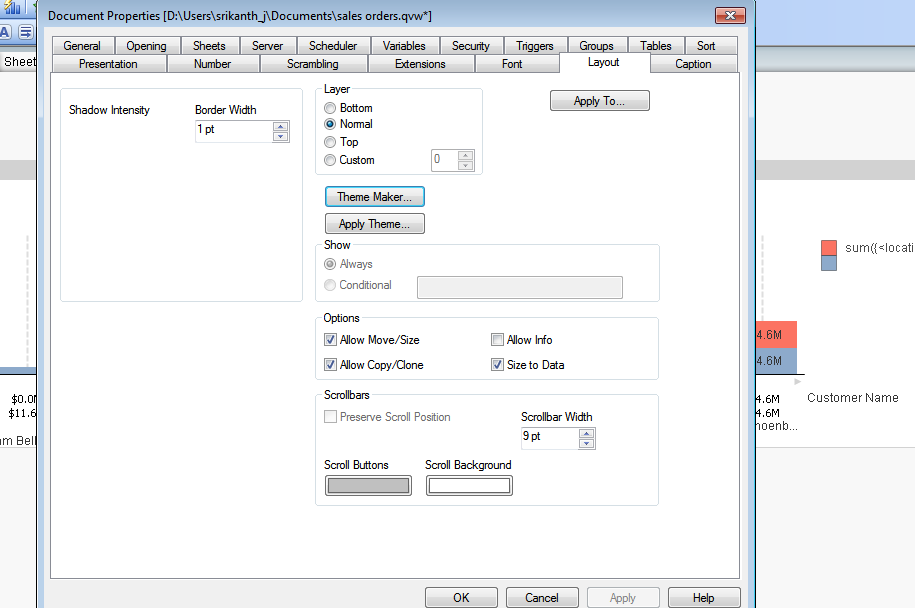
i didn't find any option like adavanced mode in style tab. See screenshot.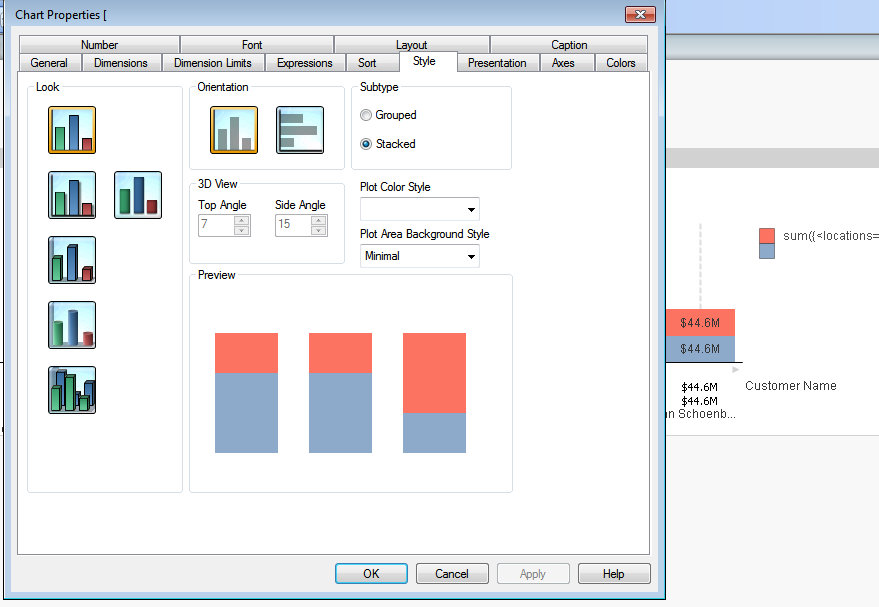
Even in layoiut of document properties i there is no such thing as style option. screenshot here
- Mark as New
- Bookmark
- Subscribe
- Mute
- Subscribe to RSS Feed
- Permalink
- Report Inappropriate Content
Would you mind, Can you sketch the needed?
- Mark as New
- Bookmark
- Subscribe
- Mute
- Subscribe to RSS Feed
- Permalink
- Report Inappropriate Content
I want my chart to be like this. under bar chart i need a list list like shown below.
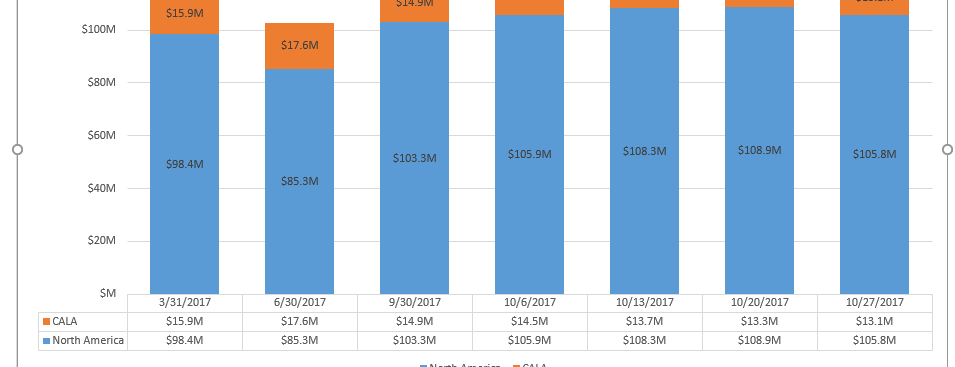
this is what i already made possible in qlikview
I hope you got it now.
- « Previous Replies
-
- 1
- 2
- Next Replies »