Unlock a world of possibilities! Login now and discover the exclusive benefits awaiting you.
- Qlik Community
- :
- All Forums
- :
- QlikView App Dev
- :
- stock per period
- Subscribe to RSS Feed
- Mark Topic as New
- Mark Topic as Read
- Float this Topic for Current User
- Bookmark
- Subscribe
- Mute
- Printer Friendly Page
- Mark as New
- Bookmark
- Subscribe
- Mute
- Subscribe to RSS Feed
- Permalink
- Report Inappropriate Content
stock per period
Hi Community,
I have warehouse data to analyze for getting the stock situation per period and product type.

I obtain the stock column using the RANGESUM function, but I need the subtotals too.
Furthermore, if I filter data (for instance the year-month) the column will not preserve the data !!!
Thanks in advance: attached the app and the data.
- Mark as New
- Bookmark
- Subscribe
- Mute
- Subscribe to RSS Feed
- Permalink
- Report Inappropriate Content
Hi,
try this as Stock expression:
=sum(aggr(RANGESUM(ABOVE(TOTAL SUM([Sell-IN]+[Sell-OUT]),0,ROWNO())),Type,Line,YearMonth,Gender))
- Mark as New
- Bookmark
- Subscribe
- Mute
- Subscribe to RSS Feed
- Permalink
- Report Inappropriate Content
Hi Youssef,
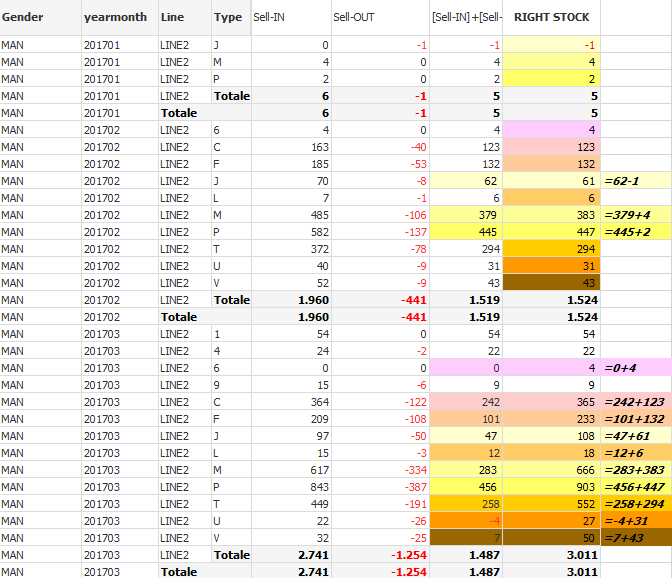
It doesn't works: furthermore my stock expression sums the Product Type stock while I need to maintain the stock separated.
I should obtain something like:

- Mark as New
- Bookmark
- Subscribe
- Mute
- Subscribe to RSS Feed
- Permalink
- Report Inappropriate Content
Maybe this can help you.
I have the next table, with the expression:
Column(3)
+
If(isNull(Above(Column(4))),
0,
Above(Column(4))
)
In the 4 row.
Hope it helps.
Enrique Mora.
- Mark as New
- Bookmark
- Subscribe
- Mute
- Subscribe to RSS Feed
- Permalink
- Report Inappropriate Content
Maybe stalwar1 can take a look here ?
- Mark as New
- Bookmark
- Subscribe
- Mute
- Subscribe to RSS Feed
- Permalink
- Report Inappropriate Content
May be this
Sum(Aggr(RangeSum(Above(Sum([Sell-IN]+[Sell-OUT]),0,RowNo())), Gender, Line, Type, YearMonth))
- Mark as New
- Bookmark
- Subscribe
- Mute
- Subscribe to RSS Feed
- Permalink
- Report Inappropriate Content
I guess only thing this is missing is the ability to add a row when it doesn't exist... for example Gender = MAN, year month = 201703, Line = LINE2 and Type = 6 doesn't exists, but you want to add the accumulation from 201702. This can only work if the above combination at least exists in the database (may be with a 0 value)
- Mark as New
- Bookmark
- Subscribe
- Mute
- Subscribe to RSS Feed
- Permalink
- Report Inappropriate Content
So here the fields order in the AGGR() function change everything ?
- Mark as New
- Bookmark
- Subscribe
- Mute
- Subscribe to RSS Feed
- Permalink
- Report Inappropriate Content
Yes, it is the Aggr() dimension order that determines what needs to be accumulated rather than the chart dimension order
- Mark as New
- Bookmark
- Subscribe
- Mute
- Subscribe to RSS Feed
- Permalink
- Report Inappropriate Content
Thanks