Unlock a world of possibilities! Login now and discover the exclusive benefits awaiting you.
- Qlik Community
- :
- All Forums
- :
- QlikView App Dev
- :
- Re: sum with dimension
- Subscribe to RSS Feed
- Mark Topic as New
- Mark Topic as Read
- Float this Topic for Current User
- Bookmark
- Subscribe
- Mute
- Printer Friendly Page
- Mark as New
- Bookmark
- Subscribe
- Mute
- Subscribe to RSS Feed
- Permalink
- Report Inappropriate Content
sum with dimension
Good morning,
I have a problem with a bar graph and a sum
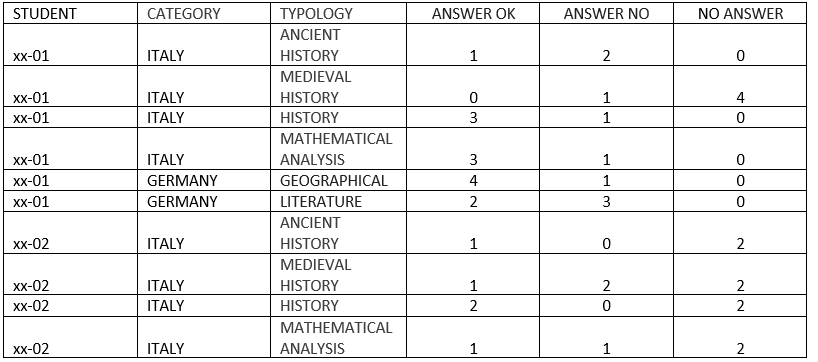
I have to add the exact answers for each candidate by category of question and typology.
Types can be:
ancient history,
Medieval history,
Mathematical analysis,
grammar
,etc
I would like the chart to give me a unique column for the HISTORY type, including the ancient and medieval ones.
How can I do?
Accepted Solutions
- Mark as New
- Bookmark
- Subscribe
- Mute
- Subscribe to RSS Feed
- Permalink
- Report Inappropriate Content
- Mark as New
- Bookmark
- Subscribe
- Mute
- Subscribe to RSS Feed
- Permalink
- Report Inappropriate Content
Hi,
Can you please sample data or app or result?
Regards,
Ravi balar
- Mark as New
- Bookmark
- Subscribe
- Mute
- Subscribe to RSS Feed
- Permalink
- Report Inappropriate Content
of course
For example, my data is provided as follows:
I would like to make the following chart
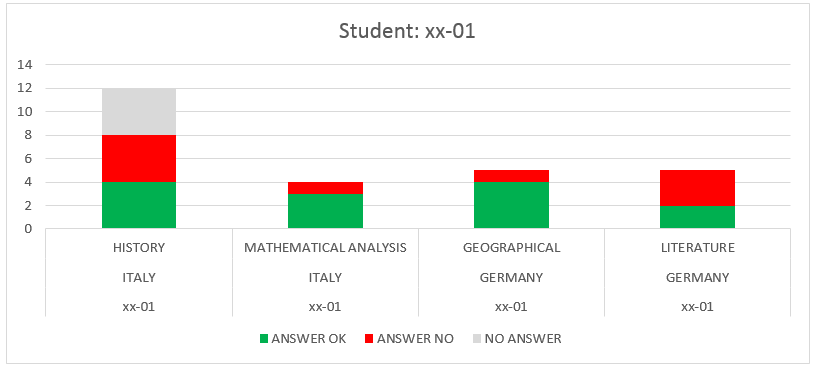
All the history fall into the typology of history
- Mark as New
- Bookmark
- Subscribe
- Mute
- Subscribe to RSS Feed
- Permalink
- Report Inappropriate Content
Hello, Alessandra!
Stacked Bar Chart with three dimensions STUDENT, CATEGORY, TYPOLOGY and expressions with specific answers don't bring an expected result?
- Mark as New
- Bookmark
- Subscribe
- Mute
- Subscribe to RSS Feed
- Permalink
- Report Inappropriate Content
no because I would like a graph like this:
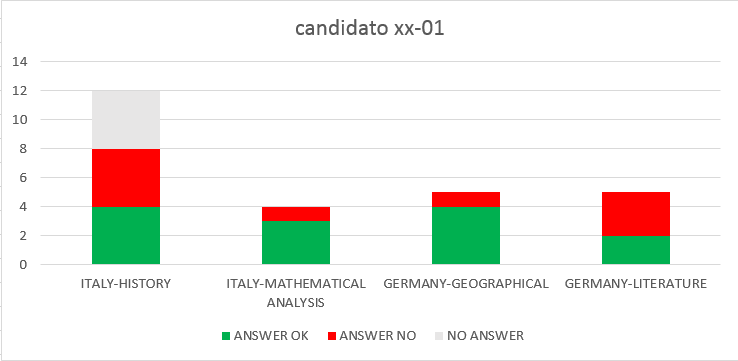
one dimension no three dimensions .
I hope I'm well explained
- Mark as New
- Bookmark
- Subscribe
- Mute
- Subscribe to RSS Feed
- Permalink
- Report Inappropriate Content
Hello Sergey,
Sorry to say but Bar chart works on max 2 dimensions.
Regards,
Ravi Balar
- Mark as New
- Bookmark
- Subscribe
- Mute
- Subscribe to RSS Feed
- Permalink
- Report Inappropriate Content
Hi,
Please find attached app.
Regards,
Ravi Balar
- Mark as New
- Bookmark
- Subscribe
- Mute
- Subscribe to RSS Feed
- Permalink
- Report Inappropriate Content
You can concatenate CATEGORY and TYPOLOGY in the script with "-" separator.
After that you will be able to draw such chart.
- Mark as New
- Bookmark
- Subscribe
- Mute
- Subscribe to RSS Feed
- Permalink
- Report Inappropriate Content
thank you