Unlock a world of possibilities! Login now and discover the exclusive benefits awaiting you.
- Qlik Community
- :
- All Forums
- :
- QlikView App Dev
- :
- Re: switching timeframe chart in dimension
- Subscribe to RSS Feed
- Mark Topic as New
- Mark Topic as Read
- Float this Topic for Current User
- Bookmark
- Subscribe
- Mute
- Printer Friendly Page
- Mark as New
- Bookmark
- Subscribe
- Mute
- Subscribe to RSS Feed
- Permalink
- Report Inappropriate Content
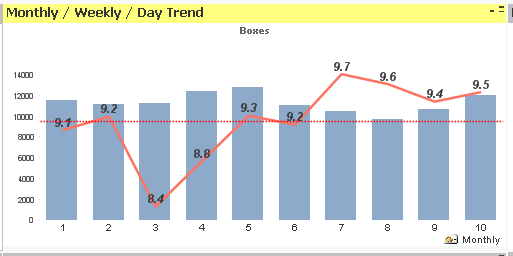
switching timeframe chart in dimension
Hi there,
I trying to do a monthly and weekly trend chart switch.
But it doesnt let me toggle the change between monthly or weekly.
And how can i change the font size of the value in the chart?
I cant find it anywhere to change it.
Thanks
Accepted Solutions
- Mark as New
- Bookmark
- Subscribe
- Mute
- Subscribe to RSS Feed
- Permalink
- Report Inappropriate Content
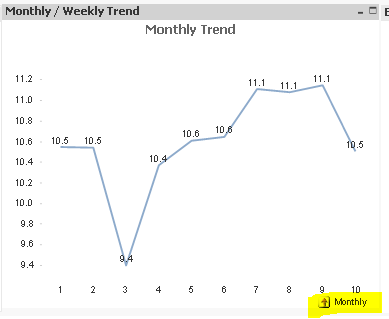
Hi Kok,
Below picture illustrates how drill down works, if thats not how you intended, use cyclic group provided by 'Frank Hartmann'.
- Mark as New
- Bookmark
- Subscribe
- Mute
- Subscribe to RSS Feed
- Permalink
- Report Inappropriate Content
Hi,
Can you explain more your first question?
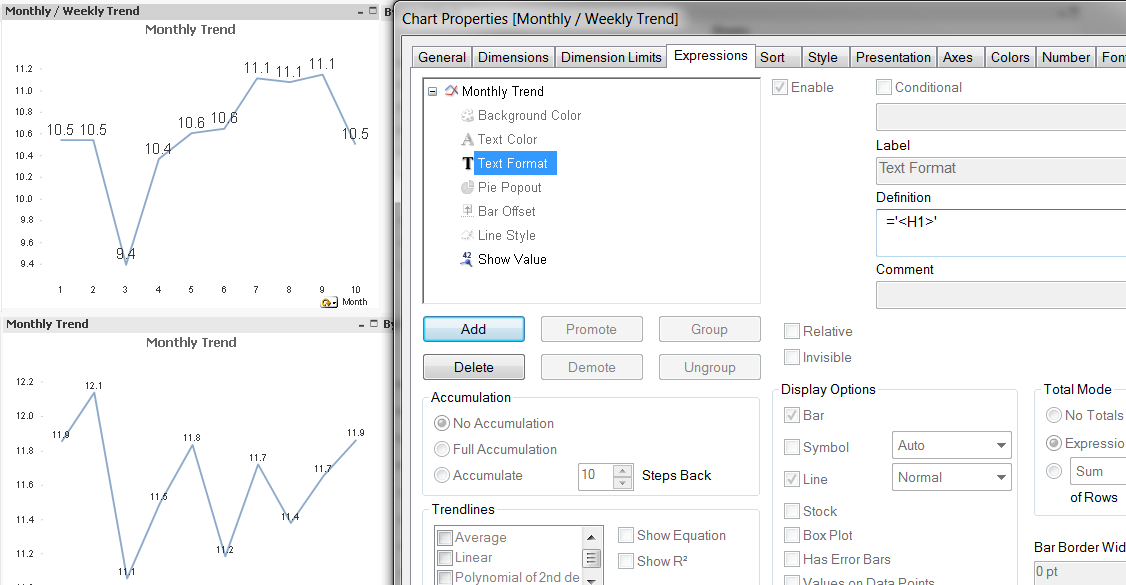
To the second question you can use:
If(Month=6,'<B>'&'<I>'&'<U>'&'<H1>')
in Text Format in graphics attributes of the expression.
- Mark as New
- Bookmark
- Subscribe
- Mute
- Subscribe to RSS Feed
- Permalink
- Report Inappropriate Content
see attached file.
try creating a cyclic group. then you are able to switch.
hope this helps
- Mark as New
- Bookmark
- Subscribe
- Mute
- Subscribe to RSS Feed
- Permalink
- Report Inappropriate Content
Hi Federico,
I got the solution already, thanks anyway for the font size.
- Mark as New
- Bookmark
- Subscribe
- Mute
- Subscribe to RSS Feed
- Permalink
- Report Inappropriate Content
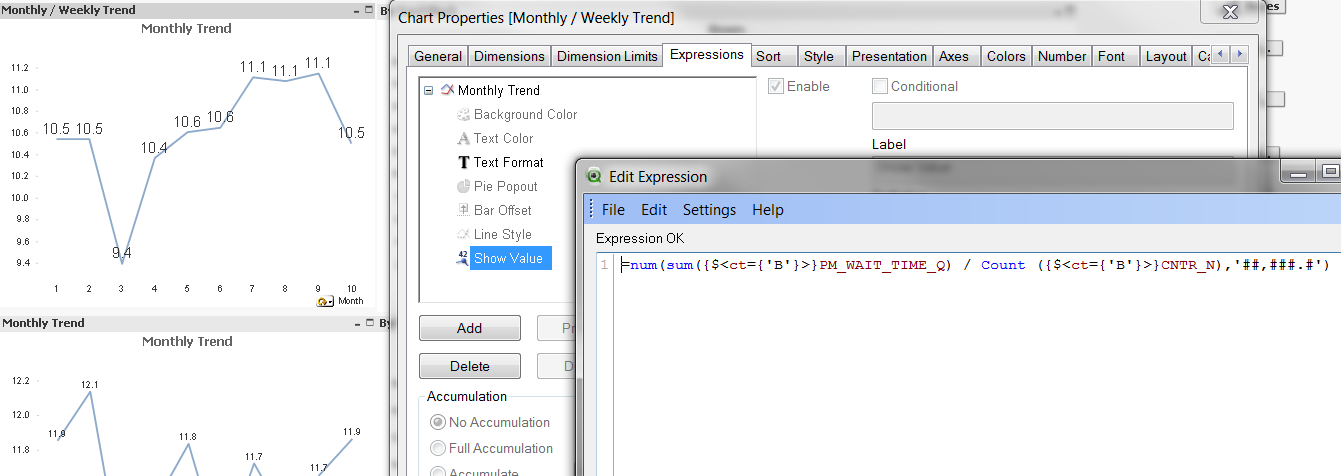
for your second probleme try as following:
- Mark as New
- Bookmark
- Subscribe
- Mute
- Subscribe to RSS Feed
- Permalink
- Report Inappropriate Content
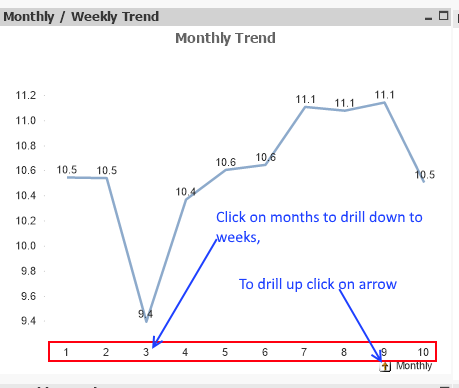
Hi Kok,
Below picture illustrates how drill down works, if thats not how you intended, use cyclic group provided by 'Frank Hartmann'.
- Mark as New
- Bookmark
- Subscribe
- Mute
- Subscribe to RSS Feed
- Permalink
- Report Inappropriate Content
Hi Frank,
I have managed to do the switch time frame on the chart by cyclic group.
How can i create a separate Button instead to toggle the time frame(month,week,day) instead on the chart itself.
Thanks
- Mark as New
- Bookmark
- Subscribe
- Mute
- Subscribe to RSS Feed
- Permalink
- Report Inappropriate Content
have a look at attached sample!
hope this is helpful!
---- Edited ----
- Mark as New
- Bookmark
- Subscribe
- Mute
- Subscribe to RSS Feed
- Permalink
- Report Inappropriate Content
Hi Frank
Doesnt work on my version, not sure what is missing.
Showing '1' and '4'
- Mark as New
- Bookmark
- Subscribe
- Mute
- Subscribe to RSS Feed
- Permalink
- Report Inappropriate Content
in the listbox you will have to put this formula to the expression, not to the title:
=if($Field='Week',$Field,if($Field='Month',$Field,if($Field='Day',$Field)))
In the charts only use this expression as dimension:
=$(= '[' & ONLY($Field) & ']')
Thats it. See attached sample
hope this helps!