Unlock a world of possibilities! Login now and discover the exclusive benefits awaiting you.
- Qlik Community
- :
- All Forums
- :
- QlikView App Dev
- :
- Re: syncing charts based on selection
- Subscribe to RSS Feed
- Mark Topic as New
- Mark Topic as Read
- Float this Topic for Current User
- Bookmark
- Subscribe
- Mute
- Printer Friendly Page
- Mark as New
- Bookmark
- Subscribe
- Mute
- Subscribe to RSS Feed
- Permalink
- Report Inappropriate Content
syncing charts based on selection
 Hello All,
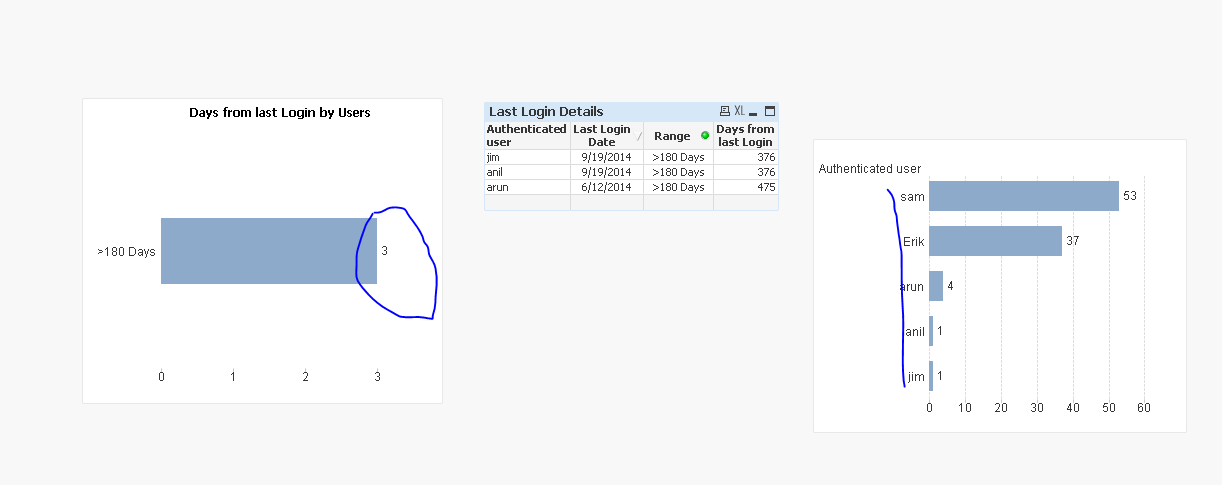
i am trying to sync two bar charts, i have attached the application and source file for reference. for example when i am clicking on one bar (ex: >180 Days) on chart 'Days from last login by Users' the value is 3, i should have same number of Users in other chart.
What modification should i do in order to make it in sync. !
Thanks for the help
Accepted Solutions
- Mark as New
- Bookmark
- Subscribe
- Mute
- Subscribe to RSS Feed
- Permalink
- Report Inappropriate Content
Try this...
- Mark as New
- Bookmark
- Subscribe
- Mute
- Subscribe to RSS Feed
- Permalink
- Report Inappropriate Content
Here my solution.
Cheers,
Patric
- Mark as New
- Bookmark
- Subscribe
- Mute
- Subscribe to RSS Feed
- Permalink
- Report Inappropriate Content
You used the wrong Log field in the Set Analysis Formula.
Cheers,
Patric
- Mark as New
- Bookmark
- Subscribe
- Mute
- Subscribe to RSS Feed
- Permalink
- Report Inappropriate Content
Patric's solution is correct, but what is the point here?
You use a bar chart to show 3 users? What is the requirement?
Maybe to show session count for these 3 users, regardless of session range?
Please elaborate.
- Mark as New
- Bookmark
- Subscribe
- Mute
- Subscribe to RSS Feed
- Permalink
- Report Inappropriate Content
best I can tell, the issue is with the expressions on the other chart. I also noticed by creating a table box with all entries and adding a filter, Kim has 2 entries so with the current expressions your numbers are off a little.
Please look at the updates made and see if this is what you are looking for
- Mark as New
- Bookmark
- Subscribe
- Mute
- Subscribe to RSS Feed
- Permalink
- Report Inappropriate Content
hi Patrick, Ioannis,
The Requirement is when no selection is made then it should show the the no. of sessions for full list of users but when we select any range from other graph the no. of users populated should match to the no. of session they have in all.
thanks for the help !
- Mark as New
- Bookmark
- Subscribe
- Mute
- Subscribe to RSS Feed
- Permalink
- Report Inappropriate Content
Hi Saurabh,
If you want both the charts in sync then update the 2 chart also with the relevant conditions like >180 days conditions .
Because in one chart you have conditions for the >180 days and other does not have , that's why its showing more values
- Mark as New
- Bookmark
- Subscribe
- Mute
- Subscribe to RSS Feed
- Permalink
- Report Inappropriate Content
Try this...