Unlock a world of possibilities! Login now and discover the exclusive benefits awaiting you.
Announcements
FLASH SALE: Save $500! Use code FLASH2026 at checkout until Feb 14th at 11:59PM ET. Register Now!
- Qlik Community
- :
- All Forums
- :
- QlikView App Dev
- :
- Re: table
Options
- Subscribe to RSS Feed
- Mark Topic as New
- Mark Topic as Read
- Float this Topic for Current User
- Bookmark
- Subscribe
- Mute
- Printer Friendly Page
Turn on suggestions
Auto-suggest helps you quickly narrow down your search results by suggesting possible matches as you type.
Showing results for
Creator
2017-11-03
07:49 AM
- Mark as New
- Bookmark
- Subscribe
- Mute
- Subscribe to RSS Feed
- Permalink
- Report Inappropriate Content
table
I want to create a table where all the KPIS on right side in one column and second column will show the last year data and 3rd column will show the current year data and 4th column will show the difference between two columns.
- « Previous Replies
-
- 1
- 2
- Next Replies »
16 Replies
Specialist
2017-11-03
07:51 AM
- Mark as New
- Bookmark
- Subscribe
- Mute
- Subscribe to RSS Feed
- Permalink
- Report Inappropriate Content
Hi Yogita
Could you please provide some sample data?
Regards
Pratyush
Creator
2017-11-03
08:00 AM
Author
- Mark as New
- Bookmark
- Subscribe
- Mute
- Subscribe to RSS Feed
- Permalink
- Report Inappropriate Content
| year | KPi1 | KPi2 | KPi3 | KPI4 |
| 2017 | 34 | 56 | 79 | 233 |
| 2017 | 35 | 23 | 22 | 222 |
| 2017 | 346 | 45 | 24 | 21 |
| 2017 | 34 | 34 | 44 | 222 |
| 2016 | 34 | 36 | 44 | 11 |
| 2016 | 34 | 43 | 4 | 11 |
| 2016 | 34 | 23 | 2 | 11 |
| 2016 | 34 | 34 | 25 | 11 |
888 Views
Creator
2017-11-03
08:02 AM
Author
- Mark as New
- Bookmark
- Subscribe
- Mute
- Subscribe to RSS Feed
- Permalink
- Report Inappropriate Content
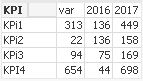
that is how I want to show in to qlikview.
| 2017 | 2016 | var | |
| KPI1 | |||
| KPI2 | |||
| KPI3 | |||
| KPI4 | |||
| KPI5 |
888 Views
Creator
2017-11-03
09:05 AM
Author
- Mark as New
- Bookmark
- Subscribe
- Mute
- Subscribe to RSS Feed
- Permalink
- Report Inappropriate Content
Any response ??
888 Views
2017-11-03
09:07 AM
- Mark as New
- Bookmark
- Subscribe
- Mute
- Subscribe to RSS Feed
- Permalink
- Report Inappropriate Content
What is var in your List?
Best Anil, When applicable please mark the correct/appropriate replies as "solution" (you can mark up to 3 "solutions". Please LIKE threads if the provided solution is helpful
888 Views
Creator
2017-11-03
09:12 AM
Author
- Mark as New
- Bookmark
- Subscribe
- Mute
- Subscribe to RSS Feed
- Permalink
- Report Inappropriate Content
difference between column 2 AND COLUMN 3
888 Views
Creator
2017-11-03
09:16 AM
Author
- Mark as New
- Bookmark
- Subscribe
- Mute
- Subscribe to RSS Feed
- Permalink
- Report Inappropriate Content
Please chcek the sample data.
888 Views
2017-11-03
09:24 AM
- Mark as New
- Bookmark
- Subscribe
- Mute
- Subscribe to RSS Feed
- Permalink
- Report Inappropriate Content
PFA
Best Anil, When applicable please mark the correct/appropriate replies as "solution" (you can mark up to 3 "solutions". Please LIKE threads if the provided solution is helpful
Creator
2017-11-03
09:32 AM
Author
- Mark as New
- Bookmark
- Subscribe
- Mute
- Subscribe to RSS Feed
- Permalink
- Report Inappropriate Content
without cross table is this possible , I don't want to touch .. data model.
888 Views
- « Previous Replies
-
- 1
- 2
- Next Replies »