Unlock a world of possibilities! Login now and discover the exclusive benefits awaiting you.
- Qlik Community
- :
- All Forums
- :
- QlikView App Dev
- :
- to show monthly trend of sales (where each month h...
- Subscribe to RSS Feed
- Mark Topic as New
- Mark Topic as Read
- Float this Topic for Current User
- Bookmark
- Subscribe
- Mute
- Printer Friendly Page
- Mark as New
- Bookmark
- Subscribe
- Mute
- Subscribe to RSS Feed
- Permalink
- Report Inappropriate Content
to show monthly trend of sales (where each month has seperate expression) in their respective cell of a column without using image
Hi ,
I have a requirement where I want to show the monthly trend of sales in their respective cell of a column.
Please find the attached document for more clarification.
I tried it using image option available in "Display Options" of expression but I don't want to use image option.
Is there any other alternative that I can use to show the respective trend in the their respective cell of a column?
Thanks,
Geeta
- Mark as New
- Bookmark
- Subscribe
- Mute
- Subscribe to RSS Feed
- Permalink
- Report Inappropriate Content
Hi, Geeta.
This can be greatly simplified with the use of the Crosstable syntax in QlikView.
See the attached file.
I have changed the load statement into a crosstable load.
Then all we need in the charts are the dimensions Year and Month with only one expression; Sum(Sales)
Hope this helps.
Regards
SKG
- Mark as New
- Bookmark
- Subscribe
- Mute
- Subscribe to RSS Feed
- Permalink
- Report Inappropriate Content
Thanks Simen Kind Gulbrandsen,
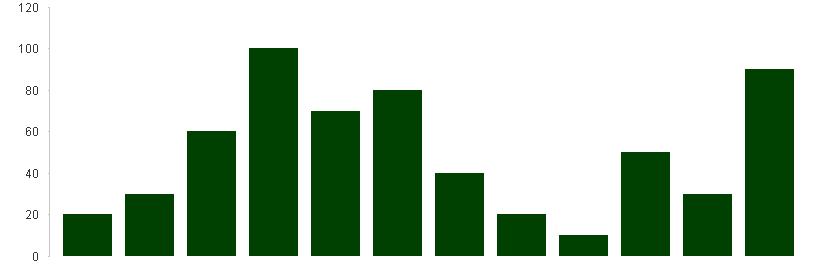
Thanks for your kind response,but I want the trend that you are showing in a separate chart in the same table .
Please refer the attached image for more clarification.
Regards,
Geeta
- Mark as New
- Bookmark
- Subscribe
- Mute
- Subscribe to RSS Feed
- Permalink
- Report Inappropriate Content
I see.
What you are asking for is called a Mini Chart. These are only available for Straight Tables and can not be added to a Pivot Table. We can "fake" it by using a container and combining two charts.
See the attached qvw.
Regards
SKG