Unlock a world of possibilities! Login now and discover the exclusive benefits awaiting you.
- Qlik Community
- :
- All Forums
- :
- QlikView App Dev
- :
- total (calculated summary) in pivot table
- Subscribe to RSS Feed
- Mark Topic as New
- Mark Topic as Read
- Float this Topic for Current User
- Bookmark
- Subscribe
- Mute
- Printer Friendly Page
- Mark as New
- Bookmark
- Subscribe
- Mute
- Subscribe to RSS Feed
- Permalink
- Report Inappropriate Content
total (calculated summary) in pivot table
Hi community,
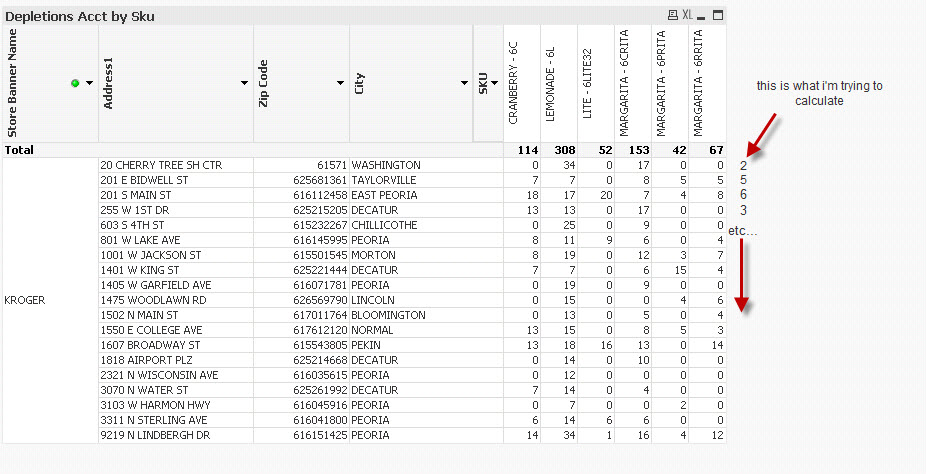
I'm trying to get a total column onto my pivot table to appear on the far right of the table. I have attached a screen shot. I can get totals on the top using partial sums but this is not what i'm trying to do.
In the attached image, you can see that the first row of data is for an address at "20 cherry treee sh ctr". I want a total count of each SKU whether the value is greater than zero, and I want this as a column on the far right of the pivot table. In the example for the first row of data the value should be 2. For the second row of data it should be 5 (because 5 skus have a value greater than zero).
Can anybody help me with this?
thanks

- « Previous Replies
-
- 1
- 2
- Next Replies »
- Mark as New
- Bookmark
- Subscribe
- Mute
- Subscribe to RSS Feed
- Permalink
- Report Inappropriate Content
Hello
Create a expreción the end of your columns, enter the code.
=if(column(1)>0,1,0)+if(column(2)>0,1,0)+if(column(3)>0,1,0)+if(column(4)>0,1,0)+if(column(5)>0,1,0)+if(column(6
)>0,1,0)
Regards
- Mark as New
- Bookmark
- Subscribe
- Mute
- Subscribe to RSS Feed
- Permalink
- Report Inappropriate Content
Hi there,
thank you for reply.
In your suggestion, you indicate summing column(1), column (2), column(3) etc... but the column is actually a DIMENSION called SKU and not an expression. I don't see how your suggestion can produce one calculated column at the end of the pivot table.
- Mark as New
- Bookmark
- Subscribe
- Mute
- Subscribe to RSS Feed
- Permalink
- Report Inappropriate Content
Hi mder,
I think you should try something using set analysis, for example: count({$<SKU=P(City={'varX'})>} SKU) where varX is a variable with the same expression you are already using in your table. I'm not sure about it, but i think you can solve it this way.
Regards,
Cesar
- Mark as New
- Bookmark
- Subscribe
- Mute
- Subscribe to RSS Feed
- Permalink
- Report Inappropriate Content
Hi community,
I'm attaching a sample document. Perpahs seeing a workign document will help generate some more insights. The difficulty i'm having is ude to displaying this column in the pivot table.
- Mark as New
- Bookmark
- Subscribe
- Mute
- Subscribe to RSS Feed
- Permalink
- Report Inappropriate Content
Hi,
it's a bit tricky... you need to define a single expression that could provide different calculations based on the level of aggregation ("Dimensionality"). Here is an example:
if (Dimensionality() <> 4,
sum({$<Year={$(=Only(Year))}>} Depletion)
,count({<SKU = {"=sum({$<Year={$(=Only(Year))}>} Depletion)>0"}>} distinct SKU)
)
Tthe working document with this example is attached.
cheers,
Oleg
Brief explanaiton:
- Dimensionality 4 is describing the subtotal above the SKU level
- The first expression in the IF is your original formula
- the second expresison (for dimensionalty 4) counts those distinct SKUs that fulfill the condition in set analysis - the total depletion is greater than 0.
- Mark as New
- Bookmark
- Subscribe
- Mute
- Subscribe to RSS Feed
- Permalink
- Report Inappropriate Content
Billiant!
thanks Oleg!
- Mark as New
- Bookmark
- Subscribe
- Mute
- Subscribe to RSS Feed
- Permalink
- Report Inappropriate Content
One other question,
yoru solution changed all the values on the pivot table to either a 1 or 0. Is it possible to implement your solution so that the sku values are preserved (i.e. still display the cases sold) but not affect the total on the right?
- Mark as New
- Bookmark
- Subscribe
- Mute
- Subscribe to RSS Feed
- Permalink
- Report Inappropriate Content
Hmm, very strangely, Dimensionality() returns 4 for both the detailed level and the SKU total! I'm guessing, when the dimension is listed accross (SKU in your case), Dimensionality() works differently...
You need to add another condition that would help differentiating between the detailed level and the SKU subtotal. For example, you can add another condition that the count(distinct SKU) =1 (representing the detailed level). The possible "glitch" could happen if certain chart line has only 1 SKU associated to it, then the expression might calculate a wrong result...
There has to be something in your data that coiuld uniquely identify a single SKU level versus SKU subtotal. Add this condition to your IF() and everything will work as expected...
cheers,
Oleg
- Mark as New
- Bookmark
- Subscribe
- Mute
- Subscribe to RSS Feed
- Permalink
- Report Inappropriate Content
You are still using SKU on the top of the pivot table?
Then use secondarydimensionality(), like
if (SecondaryDimensionality() <>0,
sum({$<Year={$(=Only(Year))}>} Depletion)
,
count({<SKU = {"=sum({$<Year={$(=Only(Year))}>} Depletion)>0"}>} distinct SKU)
)
- « Previous Replies
-
- 1
- 2
- Next Replies »