Unlock a world of possibilities! Login now and discover the exclusive benefits awaiting you.
- Qlik Community
- :
- All Forums
- :
- QlikView App Dev
- :
- turn row value in to column
- Subscribe to RSS Feed
- Mark Topic as New
- Mark Topic as Read
- Float this Topic for Current User
- Bookmark
- Subscribe
- Mute
- Printer Friendly Page
- Mark as New
- Bookmark
- Subscribe
- Mute
- Subscribe to RSS Feed
- Permalink
- Report Inappropriate Content
turn row value in to column
hi,
I have this table in data base:
order_id site_id ........
1 2
1 3
I have more columns in this table but what I need is for this specific values (site id and order id) to make it look like this in the table in QV:
order_id Site A Site Z
1 2 3
Instead of 2 rows I want to see it in columns but without affecting all other columns in the report..
can someone help?
thanks
Anat
- « Previous Replies
-
- 1
- 2
- Next Replies »
- Mark as New
- Bookmark
- Subscribe
- Mute
- Subscribe to RSS Feed
- Permalink
- Report Inappropriate Content
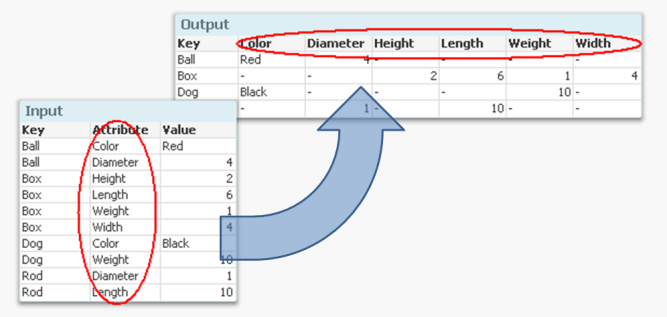
Perhaps this helps: The Generic Load
talk is cheap, supply exceeds demand
- Mark as New
- Bookmark
- Subscribe
- Mute
- Subscribe to RSS Feed
- Permalink
- Report Inappropriate Content
Generic Load Fields,,,...
- Mark as New
- Bookmark
- Subscribe
- Mute
- Subscribe to RSS Feed
- Permalink
- Report Inappropriate Content
but the generic load example is when 3 columns are involved:
but I don't have the third column I have 2.
- Mark as New
- Bookmark
- Subscribe
- Mute
- Subscribe to RSS Feed
- Permalink
- Report Inappropriate Content
Perhaps someone else will have a simpler approach, but this seems like a case where I'd use row numbering by dimensions:
Orders:
Load * INLINE [
OrderID, SiteID
1, 2
1, 3
2, 2
3, 1
3, 3
3, 4
];
Left join (Orders)
Load OrderID, SiteID, if(OrderID=previous(OrderID),rangesum(1,peek(Row)),1) as Row, 'Site ' & if(OrderID=previous(OrderID),rangesum(1,peek(Row)),1) as RowDisplay
Resident Orders
Order By OrderID, SiteID;
The resulting chart (pivoted by RowDisplay):

The concept is further elaborated on here:
- Mark as New
- Bookmark
- Subscribe
- Mute
- Subscribe to RSS Feed
- Permalink
- Report Inappropriate Content
Then how do you know that site_id 2 translates to Site A? Apparently you have that information somewhere or can generate it using some logic.
talk is cheap, supply exceeds demand
- Mark as New
- Bookmark
- Subscribe
- Mute
- Subscribe to RSS Feed
- Permalink
- Report Inappropriate Content
thanks
this seems like what I need, I will try it.
- Mark as New
- Bookmark
- Subscribe
- Mute
- Subscribe to RSS Feed
- Permalink
- Report Inappropriate Content
That got me at first too, but I think they aren't actually SiteA, SiteB, etc. They're just generic "First site, second site, third site".
- Mark as New
- Bookmark
- Subscribe
- Mute
- Subscribe to RSS Feed
- Permalink
- Report Inappropriate Content
I am not able to get SITE 1, SITE2 as column, I get it in rows. can you please explain what you put in the dimension and expression?
- Mark as New
- Bookmark
- Subscribe
- Mute
- Subscribe to RSS Feed
- Permalink
- Report Inappropriate Content
I created a pivot table and set the Row as the pivoted dimension (by dragging it to the top of the pivot table).
- « Previous Replies
-
- 1
- 2
- Next Replies »