Unlock a world of possibilities! Login now and discover the exclusive benefits awaiting you.
- Qlik Community
- :
- All Forums
- :
- QlikView App Dev
- :
- Re: unable to fix dimension as i have different da...
- Subscribe to RSS Feed
- Mark Topic as New
- Mark Topic as Read
- Float this Topic for Current User
- Bookmark
- Subscribe
- Mute
- Printer Friendly Page
- Mark as New
- Bookmark
- Subscribe
- Mute
- Subscribe to RSS Feed
- Permalink
- Report Inappropriate Content
unable to fix dimension as i have different date fields
Hi All,
I have a requirement to show case count of an item based on different dates in a single chart selection(selection can be multiple)
I can make comparative selection like ordered and issued
I have say 3 date fields
ItemOrder
Item issued
Item expired
so em facing problem in fixing dimension I have to represent in cyclic way
year-month-quarter- week
Kindly suggest some way to resolve
Regards,
Prajna
- Tags:
- new_to_qlikview
- « Previous Replies
-
- 1
- 2
- Next Replies »
- Mark as New
- Bookmark
- Subscribe
- Mute
- Subscribe to RSS Feed
- Permalink
- Report Inappropriate Content
Could you please post a sample explaining the required output?
- Mark as New
- Bookmark
- Subscribe
- Mute
- Subscribe to RSS Feed
- Permalink
- Report Inappropriate Content
hi,
I want my output like this.. here issued activated what I have selected.
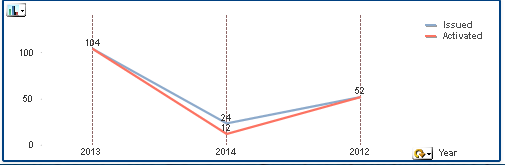
for year I have considered issued date to fetch year-month-week-quarter as the same year is there in other fields too.. which may not be in actual case.so I am stuck to select my dimension.
Thank you
Regards
Prajna
- Mark as New
- Bookmark
- Subscribe
- Mute
- Subscribe to RSS Feed
- Permalink
- Report Inappropriate Content
Either you can create a LINK table to link all these 3 date fields with rest of the fields or
you can concatenate the fields into one.
Load
ItemOrder as DateKey
resident tablename;
concatenate
Load
Item issued as DateKey
resident tablename;
concatenate
Load
Item expired as DateKey
Resident tablename;
You can create your calendar based on DateKey
- Mark as New
- Bookmark
- Subscribe
- Mute
- Subscribe to RSS Feed
- Permalink
- Report Inappropriate Content
Hi,
how abt the expression to be added that is count of item w.r.t. different selection criteria ?
count of items w.r.t ordered date
count of items w.r.t issue date
count of items w.r.t activation date
Alll the 3 I want to represent in one graph... using above load statement gives me all years but how to write an exp ?
can u please suggest me?
Regards,
Prajna
- Mark as New
- Bookmark
- Subscribe
- Mute
- Subscribe to RSS Feed
- Permalink
- Report Inappropriate Content
sure, you can set analysis for that.
1) count({<ordereddate='AnyDate',IssueDate=,ActivationDate=>}items)
2) count({<IssueDate='AnyDate',ordereddate=,ActivationDate=>}items)
3) count({<ActivationDate='AnyDate',IssueDate=,ordereddate=>}items)
Please try above, remember 'AnyDate' must be of same date format as of date field used
- Mark as New
- Bookmark
- Subscribe
- Mute
- Subscribe to RSS Feed
- Permalink
- Report Inappropriate Content
Hi,
what is any date ? is this referring to datekey? that we used before?
Thank you
Regards,
Prajna
- Mark as New
- Bookmark
- Subscribe
- Mute
- Subscribe to RSS Feed
- Permalink
- Report Inappropriate Content
No, with these expresssions you do not need any linking of tables.
AnyDate is date you want to filter
count({<ActivationDate='01/29/2014',IssueDate=,ordereddate=>}items)
- Mark as New
- Bookmark
- Subscribe
- Mute
- Subscribe to RSS Feed
- Permalink
- Report Inappropriate Content
oh..okay 
But what I want is as shown in graph above I am not giving any hard coded value.
I just want to showcase year-month-week-quarter on x- axis
and the data points should be 3
for corresponding year-month-week-quarter what is the count of item ordered
for corresponding year-month-week-quarter what is the count of item issued
for corresponding year-month-week-quarter what is the count of item activated
All the 3 parameter in one graph
hope u got what I wanted ?
Regards,
Prajna
- Mark as New
- Bookmark
- Subscribe
- Mute
- Subscribe to RSS Feed
- Permalink
- Report Inappropriate Content
In that case, you first need to merge all 3 dates into 1 and then create year-month-week-quarter from that or master calendar based on that.
Have a look at below:
1) Using Multiple Dates With Master Calendar
2) Link Date Calendar to Link Table
3) Creating a Master Calendar using multiple dates
4) Link several date fields from one table into Master Calendar
5) What is Link Tables? What is the use?
Thanks,
Angad
- « Previous Replies
-
- 1
- 2
- Next Replies »