Unlock a world of possibilities! Login now and discover the exclusive benefits awaiting you.
- Qlik Community
- :
- All Forums
- :
- QlikView App Dev
- :
- value on line crossing in line chart
- Subscribe to RSS Feed
- Mark Topic as New
- Mark Topic as Read
- Float this Topic for Current User
- Bookmark
- Subscribe
- Mute
- Printer Friendly Page
- Mark as New
- Bookmark
- Subscribe
- Mute
- Subscribe to RSS Feed
- Permalink
- Report Inappropriate Content
value on line crossing in line chart
Hi All,
do you happen to know if it is possible to display a value in point of lines crossing in line chart?
I have a line chart with two lines.
Thanks
Accepted Solutions
- Mark as New
- Bookmark
- Subscribe
- Mute
- Subscribe to RSS Feed
- Permalink
- Report Inappropriate Content
- Mark as New
- Bookmark
- Subscribe
- Mute
- Subscribe to RSS Feed
- Permalink
- Report Inappropriate Content
Like this?
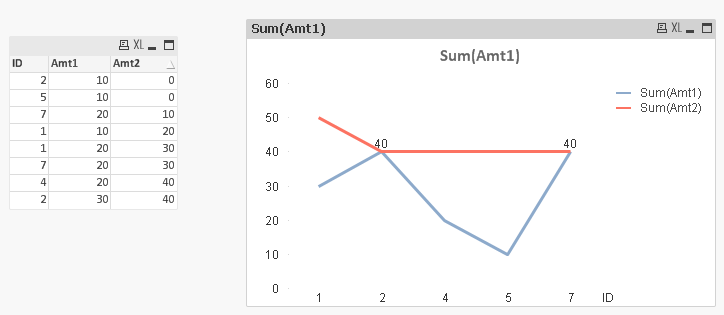
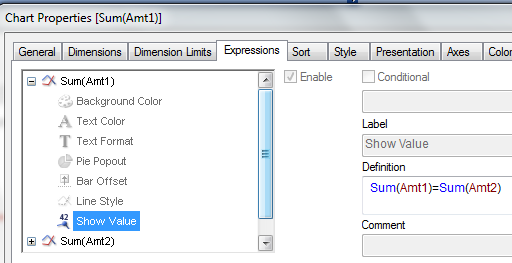
If so, try using Show Value property, like:
- Mark as New
- Bookmark
- Subscribe
- Mute
- Subscribe to RSS Feed
- Permalink
- Report Inappropriate Content
The idea is fine, but I need to set this based on difference as my values are not the exactly the same.
However if i put in Show Value (A-B) < 0.02 (and that should give me one value) - it gives me three black lines.
Can you pls test that and let me know what i'm doing wrong?
Thanks

- Mark as New
- Bookmark
- Subscribe
- Mute
- Subscribe to RSS Feed
- Permalink
- Report Inappropriate Content
Could you post your sample qvw and explain the expected output?
- Mark as New
- Bookmark
- Subscribe
- Mute
- Subscribe to RSS Feed
- Permalink
- Report Inappropriate Content
OK, it turned out it was because there were three values in the difference range, so it is solved.
However, If on the crossing of line I would like to show the dimension for which they are crossing, not the value, how to do that?
Thanks