Unlock a world of possibilities! Login now and discover the exclusive benefits awaiting you.
- Qlik Community
- :
- All Forums
- :
- QlikView App Dev
- :
- Re: values on data points query
- Subscribe to RSS Feed
- Mark Topic as New
- Mark Topic as Read
- Float this Topic for Current User
- Bookmark
- Subscribe
- Mute
- Printer Friendly Page
- Mark as New
- Bookmark
- Subscribe
- Mute
- Subscribe to RSS Feed
- Permalink
- Report Inappropriate Content
values on data points query
hi all, is there a way i can get the full value showing on my data points but have the scale only showing the reduced numbers.
i.e.
my values are in the millions, so the full number on data point (77,000,000) but the scales just showing 10 20 30 40 50 60 70 80 etc
I have attached an example
thanks
- Tags:
- new_to_qlikview
- « Previous Replies
-
- 1
- 2
- Next Replies »
Accepted Solutions
- Mark as New
- Bookmark
- Subscribe
- Mute
- Subscribe to RSS Feed
- Permalink
- Report Inappropriate Content
- Mark as New
- Bookmark
- Subscribe
- Mute
- Subscribe to RSS Feed
- Permalink
- Report Inappropriate Content
Hi,
try to remove in Number --> Thusand Symbols and Million Symbol the label £ Thousands and £ Milion.
S.
- Mark as New
- Bookmark
- Subscribe
- Mute
- Subscribe to RSS Feed
- Permalink
- Report Inappropriate Content
Hi, thanks, if i do that then the scale will show the full value also. i want the scale to remain as it is
- Mark as New
- Bookmark
- Subscribe
- Mute
- Subscribe to RSS Feed
- Permalink
- Report Inappropriate Content
Hi,
PFA ....please find the solution there. this is how you can represent in this situation.
if you find its the answer, please mark it as correct answer
- Mark as New
- Bookmark
- Subscribe
- Mute
- Subscribe to RSS Feed
- Permalink
- Report Inappropriate Content
Hi, thanks, its useful but not the answer i'm afraid.
i need the full value displayed on the end of the bars. i can get this if i remove the symbols from the number tab but that impacts the scale too.
my client has just upgraded from v9. in v9 this was possible but it doesnt seem possible in v11.2
- Mark as New
- Bookmark
- Subscribe
- Mute
- Subscribe to RSS Feed
- Permalink
- Report Inappropriate Content
Hi ,
This post is extension to the above post. you can mark values plot inside option form presentation tab. PFA
- Mark as New
- Bookmark
- Subscribe
- Mute
- Subscribe to RSS Feed
- Permalink
- Report Inappropriate Content
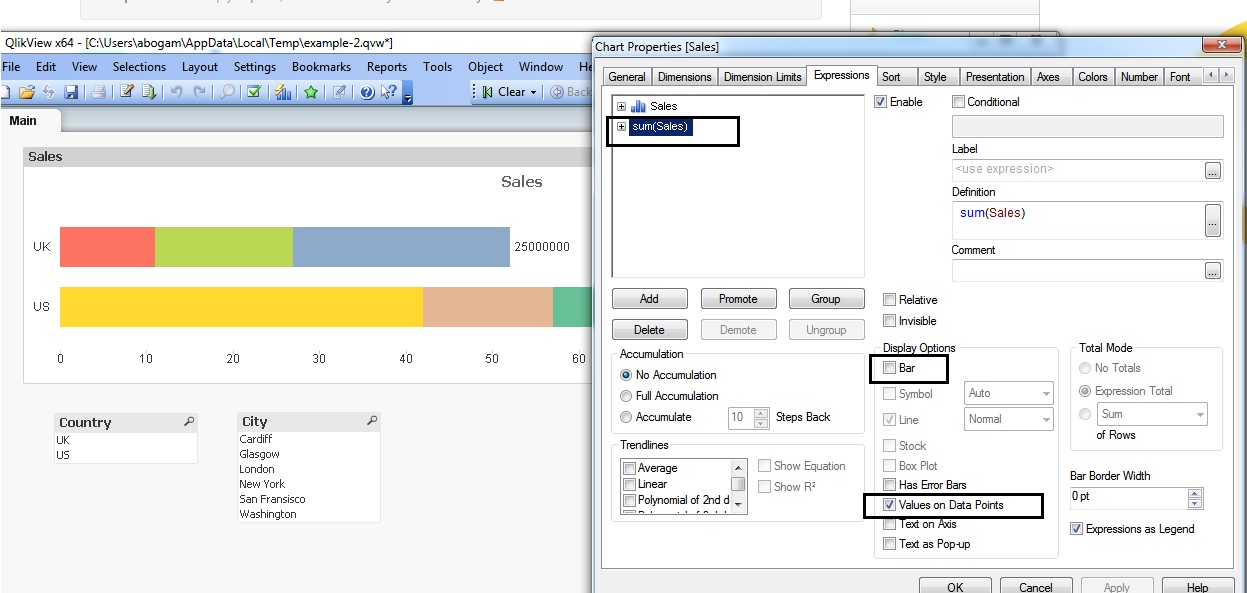
1. Add a second expression as shown in image below,

- Mark as New
- Bookmark
- Subscribe
- Mute
- Subscribe to RSS Feed
- Permalink
- Report Inappropriate Content
hi, thanks. this is something i have already tried. it doesnt give the total, it give the value of the last segment in the bar.
i need it to show the total value of sum(Sales).
i.e.
UK = 52,000,000
US = 77,000,000
Thanks
- Mark as New
- Bookmark
- Subscribe
- Mute
- Subscribe to RSS Feed
- Permalink
- Report Inappropriate Content
try this expression then,
sum(total<Country>Sales)
- Mark as New
- Bookmark
- Subscribe
- Mute
- Subscribe to RSS Feed
- Permalink
- Report Inappropriate Content
hi Hopkinsc,
PFA. this file may may help to achieve your task. In exp tab see total expression.
cheers,
Ganesh
- « Previous Replies
-
- 1
- 2
- Next Replies »