Unlock a world of possibilities! Login now and discover the exclusive benefits awaiting you.
- Qlik Community
- :
- All Forums
- :
- QlikView App Dev
- :
- visual cues expression
- Subscribe to RSS Feed
- Mark Topic as New
- Mark Topic as Read
- Float this Topic for Current User
- Bookmark
- Subscribe
- Mute
- Printer Friendly Page
- Mark as New
- Bookmark
- Subscribe
- Mute
- Subscribe to RSS Feed
- Permalink
- Report Inappropriate Content
visual cues expression
Hi
I have some expressions that figure out some timings, but I really need help with getting some highlight on them...
Op time which sums up all the average op time of each procedure that's booked into a session.
op time = Interval(sum( aggr( AvgOp, MPI, AvgOp)),'hh.:mm')
but I need to add 5 minutes turnaround time to each op booked in just to account for any gaps
so my count of ops is: count(EpisodeID)
so I use this to get that into a time plus 5 mins: interval(count(EpisodeID)*5 /24/60,'hh:mm')
then I have session length which is: interval(210/24/60,'hh:mm')
so I was going to use this to total up all the time that will be used in a session: avg op time plus turnaround time
Interval(sum( aggr( AvgOp, MPI, AvgOp)),'hh.:mm') +interval(count(EpisodeID)*5 /24/60,'hh:mm')
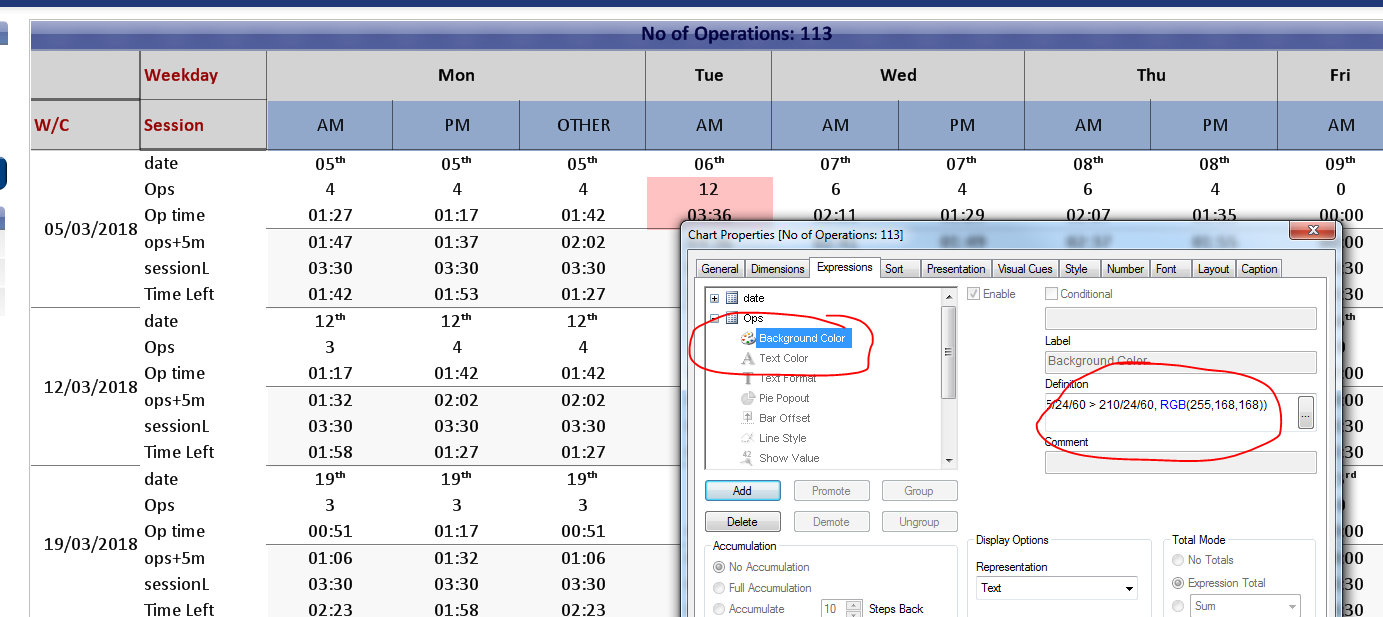
so in visual cues i wanted to highlight areas in red if there is no more space to add any more ops:
but this doesn't work - any ideas?
=if(interval(count(EpisodeID)*5 /24/60,'hh:mm')+ interval(sum( aggr( AvgOp, MPI, AvgOp)),'hh.:mm') > interval(210/24/60,'hh:mm') ,1)
I have all the expressions working separately ok - just cant get the highlight to work
thanks
Liz
- « Previous Replies
-
- 1
- 2
- Next Replies »
Accepted Solutions
- Mark as New
- Bookmark
- Subscribe
- Mute
- Subscribe to RSS Feed
- Permalink
- Report Inappropriate Content
- Mark as New
- Bookmark
- Subscribe
- Mute
- Subscribe to RSS Feed
- Permalink
- Report Inappropriate Content
Your expression probably does work but it may not be formatted correctly. Remember Interval() is merely a formatting function and the underlying value is not affected. So the first expression should probably be
=Interval(sum(aggr(AvgOp, MPI, AvgOp)) + count(EpisodeID) *5/24/60, 'hh:mm')
And the condition
=If(sum(aggr(AvgOp, MPI, AvgOp)) + count(EpisodeID) *5/24/60 > 210/24/60, 1, 0)
This does, of course, assume that the Aggr() is working correctly in this context
- Mark as New
- Bookmark
- Subscribe
- Mute
- Subscribe to RSS Feed
- Permalink
- Report Inappropriate Content
thanks for the quick reply.
yes the expression works ok and I've changed it to the one above; much neater, but the condition still doesn't work.
its the condition I put into the visual cues; they all highlight red even those that do not go over the session length.
am I using the visual cues incorrectly?
- Mark as New
- Bookmark
- Subscribe
- Mute
- Subscribe to RSS Feed
- Permalink
- Report Inappropriate Content
How about this may be
frac(Count(EpisodeID)*5/24/60)+ frac(Sum(Aggr(AvgOp, MPI, AvgOp))) > 210/24/60
- Mark as New
- Bookmark
- Subscribe
- Mute
- Subscribe to RSS Feed
- Permalink
- Report Inappropriate Content
thanks sunny
this also just returns highlight to all times. I will try to upload what I have started.
- Mark as New
- Bookmark
- Subscribe
- Mute
- Subscribe to RSS Feed
- Permalink
- Report Inappropriate Content
hi
I have scrambled the app and attached it.
I am just trying to create a calendar forward view of our theatre capacity to help book and plan, so adding red highlight to full lists and green to those that need filling etc. would help. I wasn't sure how best to do this so a pivot table looked the best option.
thanks for your help
- Mark as New
- Bookmark
- Subscribe
- Mute
- Subscribe to RSS Feed
- Permalink
- Report Inappropriate Content
I don't see any attachment?
- Mark as New
- Bookmark
- Subscribe
- Mute
- Subscribe to RSS Feed
- Permalink
- Report Inappropriate Content
I have edited the post, not sure what happened but there is now two 
- Mark as New
- Bookmark
- Subscribe
- Mute
- Subscribe to RSS Feed
- Permalink
- Report Inappropriate Content
What is not right about this?

- Mark as New
- Bookmark
- Subscribe
- Mute
- Subscribe to RSS Feed
- Permalink
- Report Inappropriate Content
on Tuesday 6th march the list is full. they have 12 ops in with avg op time of 3:36 whent he list is 3:30 but also I add 5 mins to each op to allow or turnaround times.
the other lists should be green as they are not over 3:30 hours.
- « Previous Replies
-
- 1
- 2
- Next Replies »