Unlock a world of possibilities! Login now and discover the exclusive benefits awaiting you.
- Qlik Community
- :
- All Forums
- :
- QlikView App Dev
- :
- which join do i need to apply
- Subscribe to RSS Feed
- Mark Topic as New
- Mark Topic as Read
- Float this Topic for Current User
- Bookmark
- Subscribe
- Mute
- Printer Friendly Page
- Mark as New
- Bookmark
- Subscribe
- Mute
- Subscribe to RSS Feed
- Permalink
- Report Inappropriate Content
which join do i need to apply
SuppilerScore:
LOAD
CLIENT,
VENDOR_NAME,
ROLE,
DATE_OF_REVIEW,
QM_SCORE,
CS_SCORE,
GENERAL_SCORE,
PROC_SCORE,
MANU_SCORE,
round(TOTAL_SCORE) as TOTAL_SCORE ,
pick(match(month(DATE_OF_REVIEW),'Jan','Feb','Mar','Apr','May','Jun','Jul','Aug','Sep','Oct','Nov','Dec'),
'Q4','Q4','Q4','Q1','Q1','Q1','Q2','Q2','Q2','Q3','Q3','Q3') as QUATERS,
'FY'& Date(AddYears(yearstart (DATE_OF_REVIEW, 1, 4),-1),'YY') &'-'& Date(yearstart (DATE_OF_REVIEW, 1, 4),'YY') as YEAR
FROM
[..\QVDS\SuppilerScore.qvd]
(qvd);
CrossTable(QUALITY,SCORE,8)
LOAD
CLIENT,
VENDOR_NAME as name1,
ROLE,
DATE_OF_REVIEW,
TOTAL_SCORE,
QUATERS,
YEAR,
YEAR&QUATERS AS YEARQUATER ,
QM_SCORE AS [Quality Management],
CS_SCORE as [Customer Service],
GENERAL_SCORE as General,
PROC_SCORE as Procurement ,
MANU_SCORE as Manufacture
Resident SuppilerScore;
DROP Table SuppilerScore;
LEFT join
[Suppiler Rating]:
LOAD TOTAL_SCORE,
SUPCAT
FROM
(ooxml, embedded labels, table is Sheet1);
LEFT join
LOAD CLIENT,
// LIFNR,
VENDOR_NAME as name1,
ROLE,
DATE_OF_REVIEW,
QUES_NO,
ANSWER
FROM
(qvd);
LEFT join
LOAD CLIENT,
QUES_NO,
QUES_DESC
FROM
(qvd);
till this my data flow looks ok
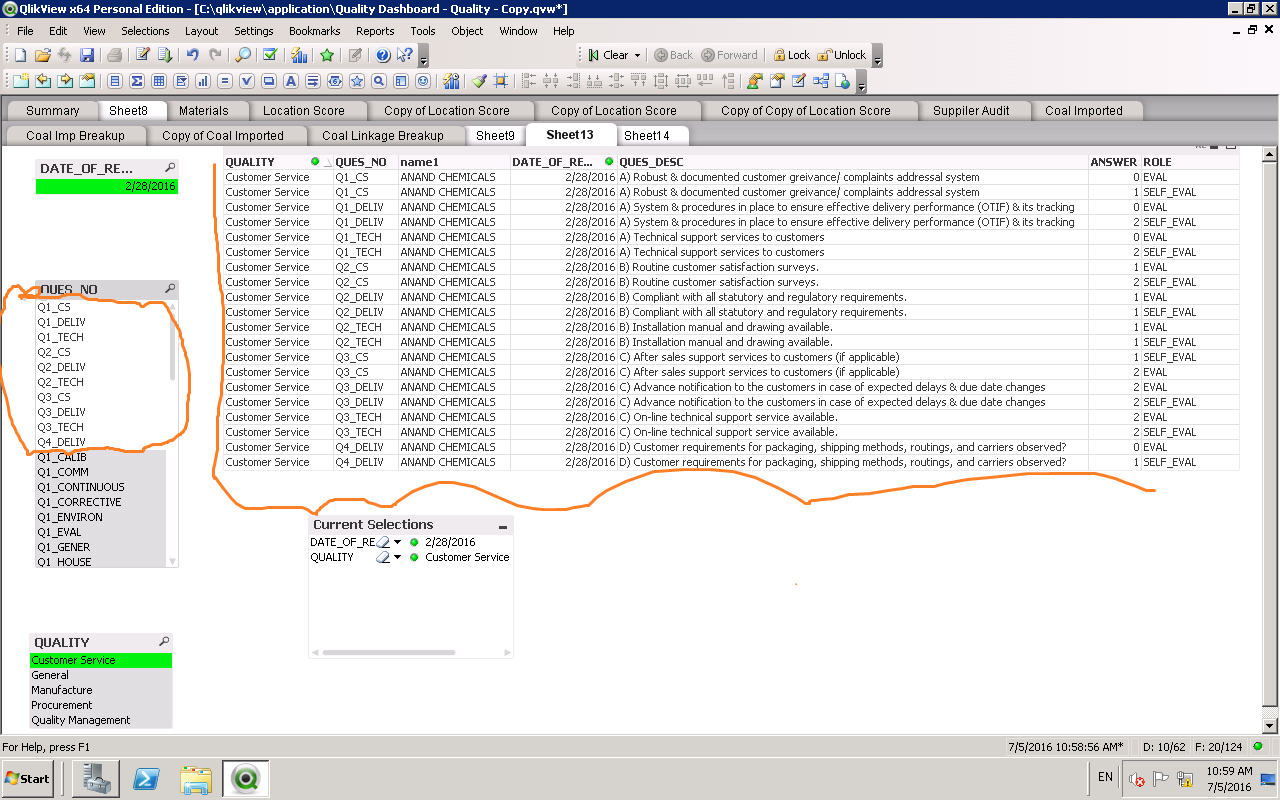
so now i am trying to group particular QUES_NO under each QUALITY VALUE
i mean
suppose for Customer Service(value)
| QUES_NO | QUALITY |
| Q1_CS | Customer Service |
| Q1_DELIV | Customer Service |
| Q1_TECH | Customer Service |
| Q2_CS | Customer Service |
| Q2_DELIV | Customer Service |
| Q2_TECH | Customer Service |
| Q3_CS | Customer Service |
| Q3_DELIV | Customer Service |
| Q3_TECH | Customer Service |
| Q4_DELIV | Customer Service |
i have done all the grouping in excel sheet and loaded in to application
Right JOIN
LOAD QUES_NO,
QUALITY
FROM
(ooxml, embedded labels, table is Sheet1);
after loading I applied RIGHT JOIN b/w this table and rest of the table,then i got wat i am looking
but unfortunately my right side entire data is gone ........
then i applied left join,i got my data back but grouping thing is not working
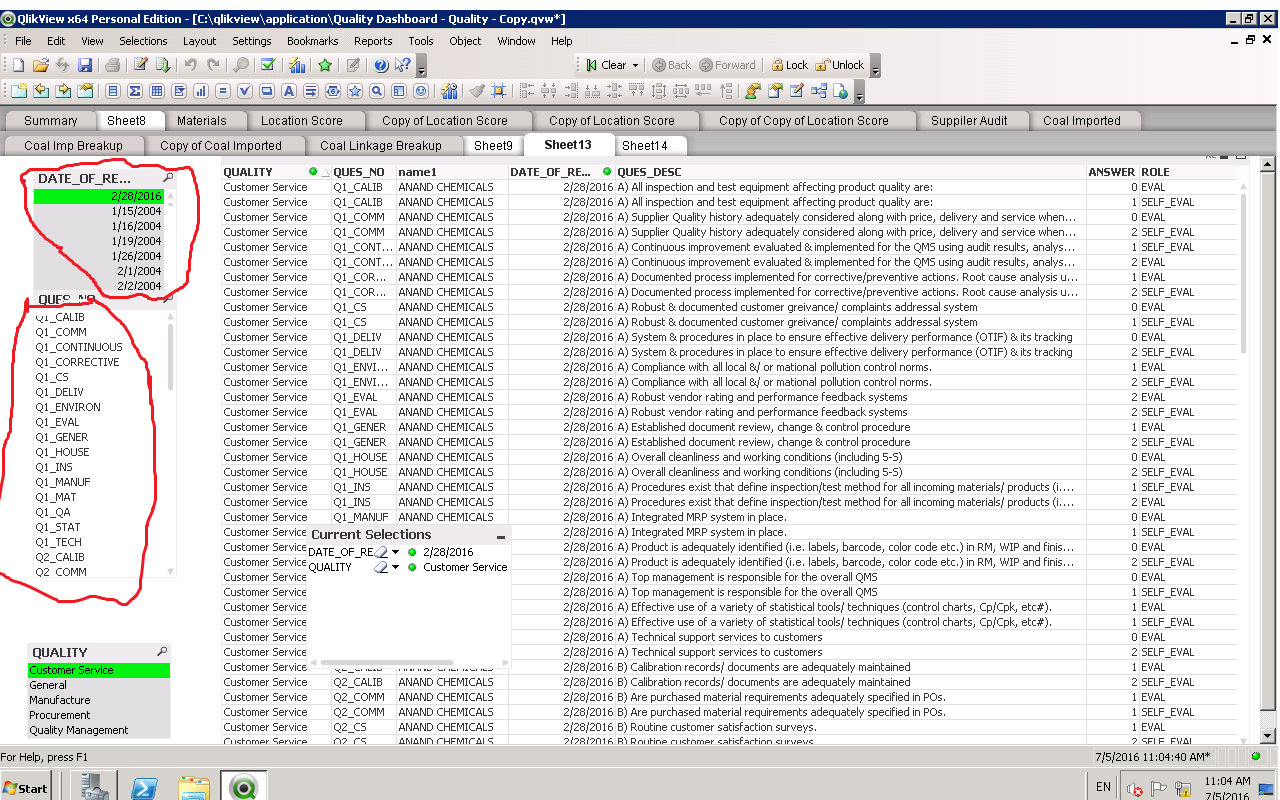
so anyone suggestion me how to make both the thing to work,i mean data and group
PFA grouping excel sheet
- « Previous Replies
-
- 1
- 2
- Next Replies »
- Mark as New
- Bookmark
- Subscribe
- Mute
- Subscribe to RSS Feed
- Permalink
- Report Inappropriate Content
sorry for miss spelling
but unfortunately my right side entire data is gone ........
when i applied RIGHT JOIN my left side entire data is gone
- Mark as New
- Bookmark
- Subscribe
- Mute
- Subscribe to RSS Feed
- Permalink
- Report Inappropriate Content
the views number is keep increasing but no one is suggesting how to resolve this ,plz i need help desperately
this is my last requirement of my project
- Mark as New
- Bookmark
- Subscribe
- Mute
- Subscribe to RSS Feed
- Permalink
- Report Inappropriate Content
Instead of this statement:
Right JOIN
LOAD QUES_NO,
QUALITY
FROM
(ooxml, embedded labels, table is Sheet1);
Before the script write:
map_quality:
mapping LOAD QUES_NO,
QUALITY
FROM
(ooxml, embedded labels, table is Sheet1);
And in one of your joins try using this:
LEFT join
LOAD CLIENT,
QUES_NO,
QUES_DESC,
Applymap('map_quality', QUES_NO, ':') as QUALITY
FROM
(qvd);
- Mark as New
- Bookmark
- Subscribe
- Mute
- Subscribe to RSS Feed
- Permalink
- Report Inappropriate Content
HI,thanks for your response man.,
looks like i got some thing but not a perfect one ..... ,
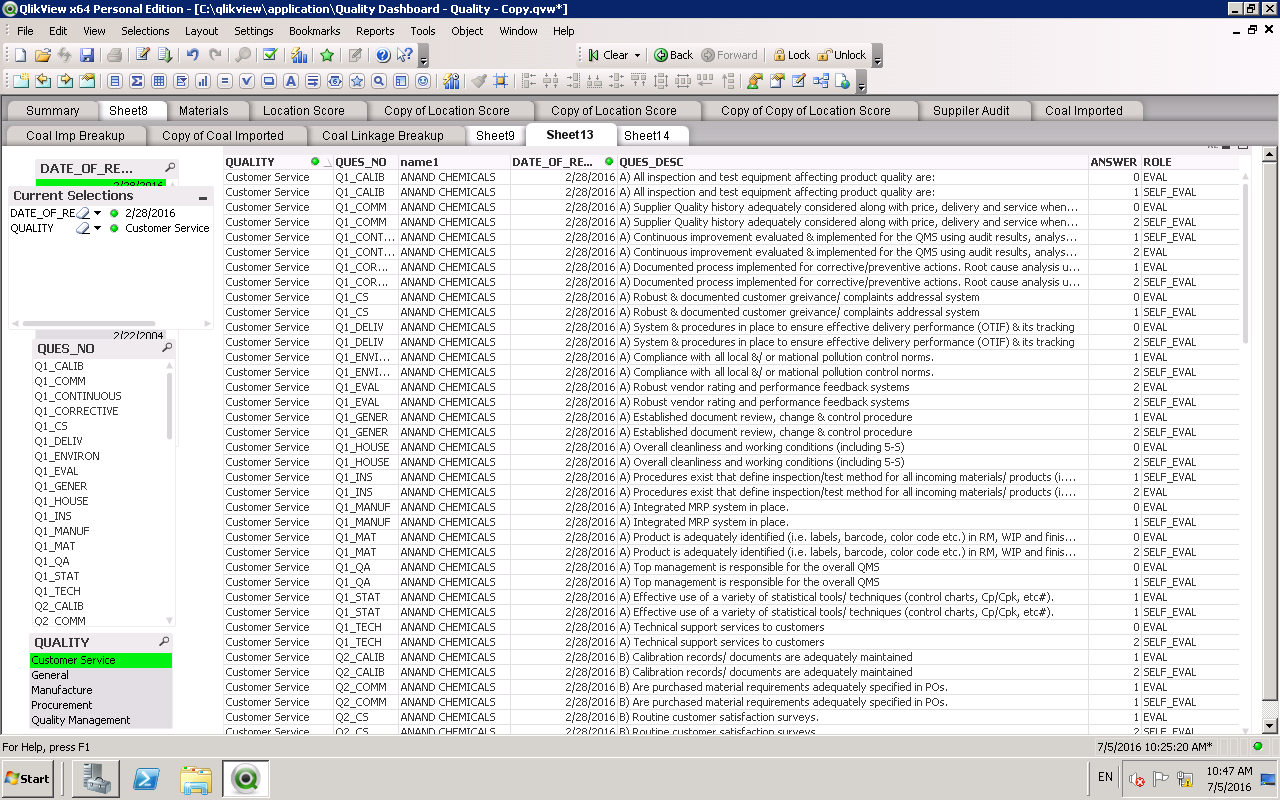
after loading i tried to display it in a straight table
Dimeansion:QUES_DESC
Expression:=FirstSortedValue({<ROLE={EVAL}>}ANSWER,-DATE_OF_REVIEW)
by ENABLING suppress null value for QUES_DESC dimenasion
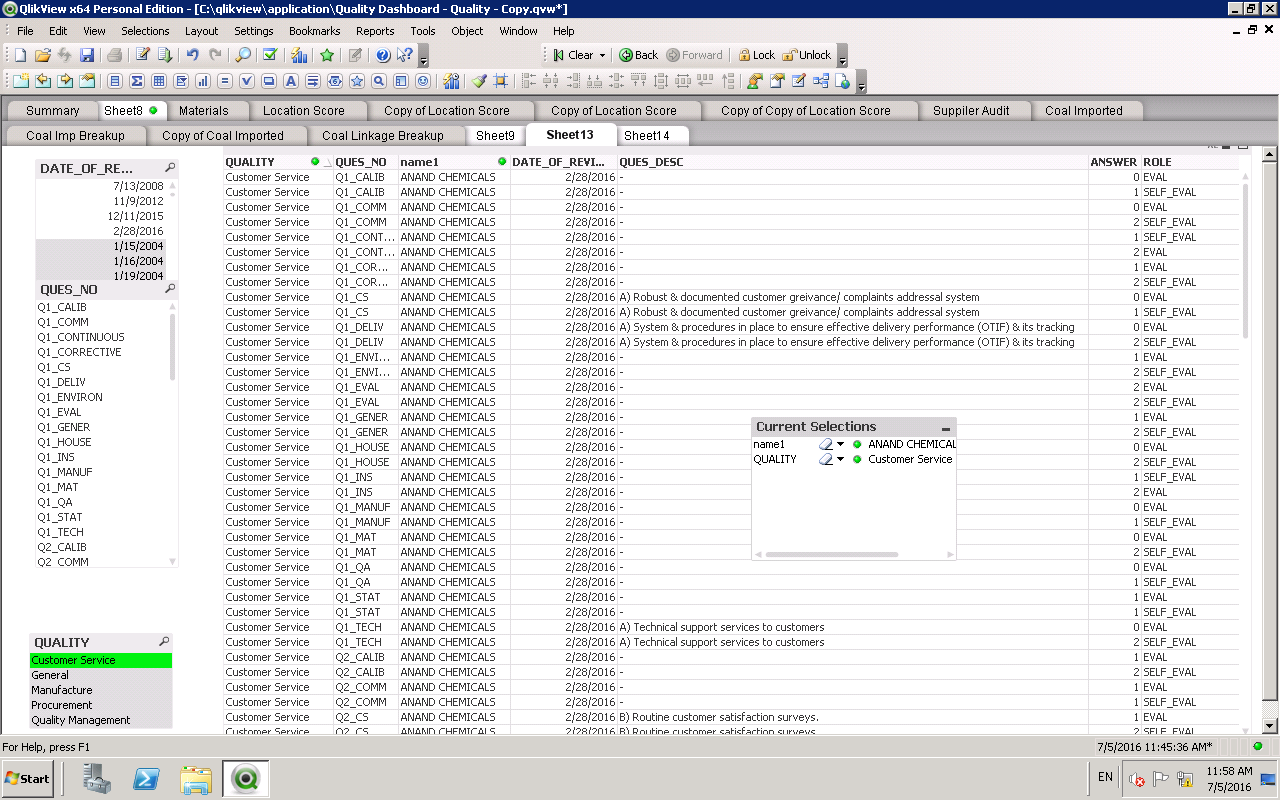
i got this (column with zero value are missing)
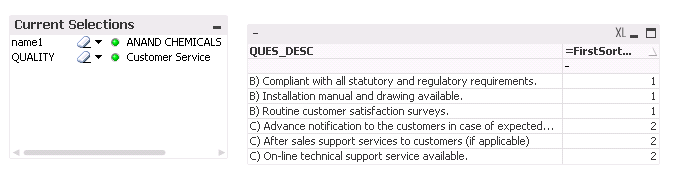
so if you think ,the first slide table data flow is a proper flow,then can you plz suggest me wat expression do i need to writing down so that even the column with ZERO answer should also display
- Mark as New
- Bookmark
- Subscribe
- Mute
- Subscribe to RSS Feed
- Permalink
- Report Inappropriate Content
just try to click on screen short the table will be more clear for you
- Mark as New
- Bookmark
- Subscribe
- Mute
- Subscribe to RSS Feed
- Permalink
- Report Inappropriate Content
just try to click on screen short the table will be more clear for you
- Mark as New
- Bookmark
- Subscribe
- Mute
- Subscribe to RSS Feed
- Permalink
- Report Inappropriate Content
Instead of right join use right keep so that u will get separate table if there are same column name rename it and use it in chart.
- Mark as New
- Bookmark
- Subscribe
- Mute
- Subscribe to RSS Feed
- Permalink
- Report Inappropriate Content
right join or right keep that wont make diff ,i applying either of them u will lose ur left side data
- Mark as New
- Bookmark
- Subscribe
- Mute
- Subscribe to RSS Feed
- Permalink
- Report Inappropriate Content
What is your requirement exactly.
Why u cant create new table using resident data.And apply right join if u find duplicate columns use qualify , unqualify.
- « Previous Replies
-
- 1
- 2
- Next Replies »