Unlock a world of possibilities! Login now and discover the exclusive benefits awaiting you.
- Qlik Community
- :
- All Forums
- :
- QlikView App Dev
- :
- why is Date2-Date1 and sum(Date2-Date1) different
- Subscribe to RSS Feed
- Mark Topic as New
- Mark Topic as Read
- Float this Topic for Current User
- Bookmark
- Subscribe
- Mute
- Printer Friendly Page
- Mark as New
- Bookmark
- Subscribe
- Mute
- Subscribe to RSS Feed
- Permalink
- Report Inappropriate Content
why is Date2-Date1 and sum(Date2-Date1) different
Hello,
I have a chart where I have three dimensions
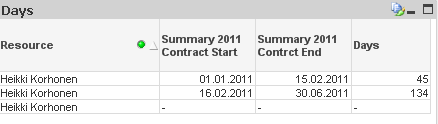
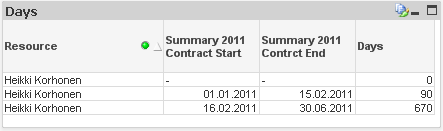
Resource Start Date End Date
No row is repeating for these three dimensions. Then i am just checking a few expressions and i have noticed something strange. When i take the expression (End Date - Start Date), it is giving the correct date different. However, when i take sum(End Date - Start Date), The value becomes really huge
I think that if no row is repeating for these three dimensions, then the sum should not make any difference over (End Date - Start Date)
I have created a sample data with five rows, and on that sample data, the sum is not making any difference, which makes sense. However, on real date, the sum is changing the results.
the below image shows when i am simple taking the data difference (End - Start)
The below image shows when i am taking sum over difference .i.e sum(end - start)
Can someone see what might be wrong with my data or expression?
Arif
- « Previous Replies
-
- 1
- 2
- Next Replies »
- Mark as New
- Bookmark
- Subscribe
- Mute
- Subscribe to RSS Feed
- Permalink
- Report Inappropriate Content
Hello Arif,
What kind of charts are you using? Is there any chance that you have a synthetic table that may be causing wrong results? If you check the attached application you will see how the Sum() and the + works fine.
Hope that helps.
BI Consultant
EDIT: I have modified the file attached to show Chris's logic.
- Mark as New
- Bookmark
- Subscribe
- Mute
- Subscribe to RSS Feed
- Permalink
- Report Inappropriate Content
The difference is aggregation.
Just based on the math of it you have 2 records with 1/1/2011-15/02/2011 and 5 records with 16/02/2011-30/06/2011
When you wrap a calculation in an aggregate function like "sum" the function will solve the calculation at the atomic level and then roll it up to the summary level shown based on the function(sum, avg...)
If that is not the case you should post your qvw with data because I am sure there is something in your data causing the multiplication.
- Mark as New
- Bookmark
- Subscribe
- Mute
- Subscribe to RSS Feed
- Permalink
- Report Inappropriate Content
Plain and simple. Thanks Chris!
- Mark as New
- Bookmark
- Subscribe
- Mute
- Subscribe to RSS Feed
- Permalink
- Report Inappropriate Content
I know what aggregation does. But the problem here is that i dont have more than one record for each data. That is what i mentioned in my problem. I have one row for each resource, start date and end date. and this is exactly why am I confused. It would have perfectly made sense if we had more than one record for each resource, start date and end date. But here we have only one row, and even still, we are getting a different result
Arif
- Mark as New
- Bookmark
- Subscribe
- Mute
- Subscribe to RSS Feed
- Permalink
- Report Inappropriate Content
I have put the above fields in a table box to see if I am getting more rows , but even there, I am getting only the rows that are shown in the table above. I donthave multiple rows.
I know there is something wrong with the data, but what is wrong, that is something i am not able to figure out.
Arif
- Mark as New
- Bookmark
- Subscribe
- Mute
- Subscribe to RSS Feed
- Permalink
- Report Inappropriate Content
Hi Arif,
As I mentioned above, are there any unwanted synthetic tables or automatic concatenations you might not aware of? Did you check the application I attached above?
If posible, share some sample application so we can check your script further.
Hope that helps.
BI Consultant
- Mark as New
- Bookmark
- Subscribe
- Mute
- Subscribe to RSS Feed
- Permalink
- Report Inappropriate Content
Hello,
I have attached a sample excel file and a qvw file. as you can see, sum over difference is giving an incorrect result. This happens only when i am using the crosstable function over the table. can you see what is the problem with the crosstable function
Arif
- Mark as New
- Bookmark
- Subscribe
- Mute
- Subscribe to RSS Feed
- Permalink
- Report Inappropriate Content
ArifShah wrote:
I know what aggregation does. But the problem here is that i dont have more than one record for each data. That is what i mentioned in my problem. I have one row for each resource, start date and end date. and this is exactly why am I confused. It would have perfectly made sense if we had more than one record for each resource, start date and end date. But here we have only one row, and even still, we are getting a different result
But you do have multiple records per resource, start date and end date, your cross table load is creating a record per month. You could see this in table view or in a table box, as suggested above.
- Mark as New
- Bookmark
- Subscribe
- Mute
- Subscribe to RSS Feed
- Permalink
- Report Inappropriate Content
ohh okay, I got it now. how can i mention distinct start and distinct end inside the sum expression?
- « Previous Replies
-
- 1
- 2
- Next Replies »