Unlock a world of possibilities! Login now and discover the exclusive benefits awaiting you.
- Qlik Community
- :
- All Forums
- :
- QlikView App Dev
- :
- AccessPoint issues with Sparklines
- Subscribe to RSS Feed
- Mark Topic as New
- Mark Topic as Read
- Float this Topic for Current User
- Bookmark
- Subscribe
- Mute
- Printer Friendly Page
- Mark as New
- Bookmark
- Subscribe
- Mute
- Subscribe to RSS Feed
- Permalink
- Report Inappropriate Content
AccessPoint issues with Sparklines
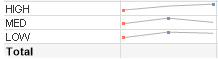
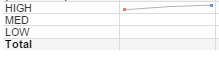
I have a straight table that is using a mini chart for a sparkline. When I work with the application in QV it displays the sparklines perfectly, but once I publish the application to AccessPoint I get erratic results. Below is a snapshot of the sparklines in both QV and AccessPoint. The filters that are applied are the same for both, but you will see that AccessPoint is not displaying all sparklines.
Application in QV:
Application in AccessPoint:
My expression logic that I am using is the following:
- Count({<Year=>}Distinct CustomerID)
I am using Google Chrome (Version 47.0.2526.106) for my browser into AccessPoint. Any ideas why this would be occurring?
- Mark as New
- Bookmark
- Subscribe
- Mute
- Subscribe to RSS Feed
- Permalink
- Report Inappropriate Content
Does it look perfect on IE?
- Mark as New
- Bookmark
- Subscribe
- Mute
- Subscribe to RSS Feed
- Permalink
- Report Inappropriate Content
I have the same issue when viewing in IE 11
- Mark as New
- Bookmark
- Subscribe
- Mute
- Subscribe to RSS Feed
- Permalink
- Report Inappropriate Content
Hi Ryan,
Try opening the plugin version in IE. That gives the best output compared to chrome.
Regards
KC
KC
- Mark as New
- Bookmark
- Subscribe
- Mute
- Subscribe to RSS Feed
- Permalink
- Report Inappropriate Content
Opening the app in the IE Plugin worked great. Thanks
- Mark as New
- Bookmark
- Subscribe
- Mute
- Subscribe to RSS Feed
- Permalink
- Report Inappropriate Content
Hi Ryan,
If you got the solution then please mark the correct answer and close the thread. 
Happy holidays.
Regards
KC
KC
- Mark as New
- Bookmark
- Subscribe
- Mute
- Subscribe to RSS Feed
- Permalink
- Report Inappropriate Content
Hi ,
Open ,


Or else in IE,
Preferred Client As Internet Explorer Plugin
or Else
Check in QMC -> System -> qlikview Webserver -> Acess Point -> Default Preferred Client
Hope this Helps,
Regards,
Hirish
“Aspire to Inspire before we Expire!”