Unlock a world of possibilities! Login now and discover the exclusive benefits awaiting you.
- Qlik Community
- :
- All Forums
- :
- QlikView App Dev
- :
- Re: Calculate total Customer Count from accumulate...
- Subscribe to RSS Feed
- Mark Topic as New
- Mark Topic as Read
- Float this Topic for Current User
- Bookmark
- Subscribe
- Mute
- Printer Friendly Page
- Mark as New
- Bookmark
- Subscribe
- Mute
- Subscribe to RSS Feed
- Permalink
- Report Inappropriate Content
Calculate total Customer Count from accumulate in and out counts at fixed time interval
Hi, Community,
i have the followng sample data...
i would like to calculate the hourly , daily and monthly total customer count with the below data,
i have create a cyclic timegroup with month, day and hour dimension, but i dont know how to write the expression,...
| Site | raw_tl_history_datetime | tl_history_datetimeforcustomercount | tl_history_counter_in | tl_history_counter_out |
| A | 2016-09-05 09:30 | 5/9/2016 | 0 | 0 |
| A | 2016-09-05 10:00 | 5/9/2016 | 5 | 3 |
| A | 2016-09-05 10:30 | 5/9/2016 | 6 | 5 |
| A | 2016-09-05 11:00 | 5/9/2016 | 14 | 14 |
| A | 2016-09-05 11:30 | 5/9/2016 | 24 | 23 |
| A | 2016-09-05 12:00 | 5/9/2016 | 34 | 25 |
| A | 2016-09-05 12:30 | 5/9/2016 | 44 | 36 |
| A | 2016-09-05 13:00 | 5/9/2016 | 46 | 40 |
| A | 2016-09-05 13:30 | 5/9/2016 | 48 | 46 |
| A | 2016-09-05 14:00 | 5/9/2016 | 49 | 48 |
| A | 2016-09-05 14:30 | 5/9/2016 | 53 | 49 |
| A | 2016-09-05 15:00 | 5/9/2016 | 55 | 54 |
| A | 2016-09-05 15:30 | 5/9/2016 | 58 | 56 |
| A | 2016-09-05 16:00 | 5/9/2016 | 62 | 57 |
| A | 2016-09-05 16:30 | 5/9/2016 | 65 | 59 |
| A | 2016-09-05 17:00 | 5/9/2016 | 67 | 60 |
| A | 2016-09-05 17:30 | 5/9/2016 | 70 | 60 |
| A | 2016-09-05 18:00 | 5/9/2016 | 76 | 61 |
| A | 2016-09-05 18:30 | 5/9/2016 | 80 | 62 |
| A | 2016-09-05 19:00 | 5/9/2016 | 88 | 63 |
| A | 2016-09-05 19:30 | 5/9/2016 | 90 | 64 |
| A | 2016-09-05 20:00 | 5/9/2016 | 111 | 67 |
| A | 2016-09-05 20:30 | 5/9/2016 | 121 | 100 |
| A | 2016-09-05 21:00 | 5/9/2016 | 131 | 111 |
| A | 2016-09-05 21:30 | 5/9/2016 | 144 | 144 |
| A | 2016-09-06 09:30 | 6/9/2016 | 0 | 0 |
| A | 2016-09-06 10:00 | 6/9/2016 | 6 | 3 |
| A | 2016-09-06 10:30 | 6/9/2016 | 8 | 5 |
| A | 2016-09-06 11:00 | 6/9/2016 | 16 | 14 |
| A | 2016-09-06 11:30 | 6/9/2016 | 20 | 18 |
| A | 2016-09-06 12:00 | 6/9/2016 | 35 | 32 |
| A | 2016-09-06 12:30 | 6/9/2016 | 45 | 44 |
| A | 2016-09-06 13:00 | 6/9/2016 | 50 | 46 |
| A | 2016-09-06 13:30 | 6/9/2016 | 51 | 47 |
| A | 2016-09-06 14:00 | 6/9/2016 | 53 | 50 |
| A | 2016-09-06 14:30 | 6/9/2016 | 57 | 51 |
| A | 2016-09-06 15:00 | 6/9/2016 | 59 | 52 |
| A | 2016-09-06 15:30 | 6/9/2016 | 60 | 53 |
| A | 2016-09-06 16:00 | 6/9/2016 | 78 | 67 |
| A | 2016-09-06 16:30 | 6/9/2016 | 80 | 68 |
| A | 2016-09-06 17:00 | 6/9/2016 | 88 | 70 |
| A | 2016-09-06 17:30 | 6/9/2016 | 90 | 80 |
| A | 2016-09-06 18:00 | 6/9/2016 | 92 | 88 |
| A | 2016-09-06 18:30 | 6/9/2016 | 94 | 89 |
| A | 2016-09-06 19:00 | 6/9/2016 | 99 | 91 |
| A | 2016-09-06 19:30 | 6/9/2016 | 104 | 93 |
| A | 2016-09-06 20:00 | 6/9/2016 | 111 | 99 |
| A | 2016-09-06 20:30 | 6/9/2016 | 131 | 120 |
| A | 2016-09-06 21:00 | 6/9/2016 | 140 | 133 |
| A | 2016-09-06 21:30 | 6/9/2016 | 145 | 145 |
for example, at the 10 hour data point, it should show 19( last record of the hour( indicate by the first record of the next hour)-first record of the hour)..
calculate from :
14-5=9 +
16-6=10
at the 5 day data point, it should show 144..
144-0 =144( last record of the day - first record of the day)
is that possible...
- Mark as New
- Bookmark
- Subscribe
- Mute
- Subscribe to RSS Feed
- Permalink
- Report Inappropriate Content
So, based on the dimension you are on, you would want to see the This Period - Last Period?
- Mark as New
- Bookmark
- Subscribe
- Mute
- Subscribe to RSS Feed
- Permalink
- Report Inappropriate Content
thanks for replying sunny.
sunny , i am thinking to use last period -this period, because for example, when i change to hour dimension of the cyclic group, it shows the total number of customer walked in the store at that hour period, but the record is taken in 30 min interval...so.i think..e.g at the 10 hour data point, use the last period of the record(since no record is taken at 10:59, so use the first record of the next hour, that is the record taken at 11:00)-first record of the hour(the one record taken at 10:00)..
the "in" column is the accumulate customer walked in, so when i find the difference between this 2 time , i can know how many customers have been walked in the site at the 10th hour period, that is from 10:00 to 10:59...
i have tried for a while but cannot fix it...
- Mark as New
- Bookmark
- Subscribe
- Mute
- Subscribe to RSS Feed
- Permalink
- Report Inappropriate Content
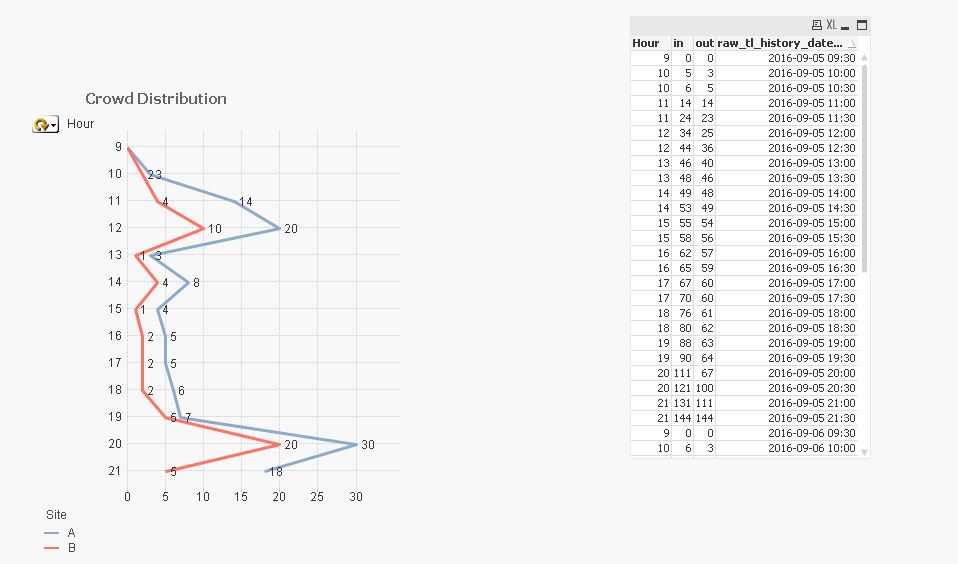
i guess it also make sense to use max(this period) -min(this period) and us a line chart to present it, like attachement testcount3.qvw...Thanks~