Unlock a world of possibilities! Login now and discover the exclusive benefits awaiting you.
- Qlik Community
- :
- All Forums
- :
- QlikView App Dev
- :
- Change displayed label of dimension of a barchart
- Subscribe to RSS Feed
- Mark Topic as New
- Mark Topic as Read
- Float this Topic for Current User
- Bookmark
- Subscribe
- Mute
- Printer Friendly Page
- Mark as New
- Bookmark
- Subscribe
- Mute
- Subscribe to RSS Feed
- Permalink
- Report Inappropriate Content
Change displayed label of dimension of a barchart
I want to display a timetable with the following data:
LOAD * INLINE[
Id, Begin, End, Group
L1|1, 08:00:00, 12:00:00, L1
L1|2, 12:45:00, 16:00:00, L1
L2|1, 15:00:00, 18:00:00, L2
]
As you can see, "Group" is part of the "Id". To create the timetable, i need a bar for each Id (which is my dimension), which has the length (End - Begin) as expression and an offset of "Begin". Now I intend to display "Group" as the dimension, but if I do so and add "Group" as a second dimension, nothing can be read as dimension and in addition something weird happens to the diagram itself.
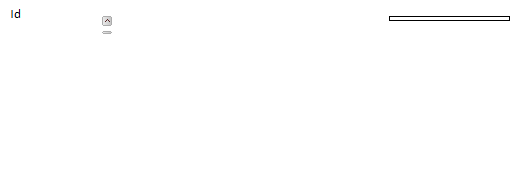
This is the way it is displayed right now

This is how it looks like, if i add the second dimension (the column with Ids is empty and it is only one row displayed, i assume)
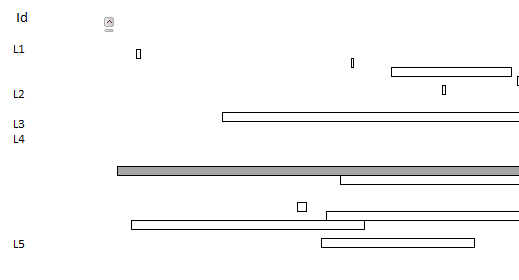
And that's the way i want the diagram to look like
Please notice that the whole dataset is about 6000 records
Can anyone help?