Unlock a world of possibilities! Login now and discover the exclusive benefits awaiting you.
Announcements
Qlik Connect 2025: 3 days of full immersion in data, analytics, and AI. May 13-15 | Orlando, FL:
Learn More
- Qlik Community
- :
- All Forums
- :
- QlikView App Dev
- :
- Cumulative average Month by month
Options
- Subscribe to RSS Feed
- Mark Topic as New
- Mark Topic as Read
- Float this Topic for Current User
- Bookmark
- Subscribe
- Mute
- Printer Friendly Page
Turn on suggestions
Auto-suggest helps you quickly narrow down your search results by suggesting possible matches as you type.
Showing results for
Anonymous
Not applicable
2018-07-16
06:09 PM
- Mark as New
- Bookmark
- Subscribe
- Mute
- Subscribe to RSS Feed
- Permalink
- Report Inappropriate Content
Cumulative average Month by month
Hi community.
I am trying to generate an accumulated average month by month.
This way it works: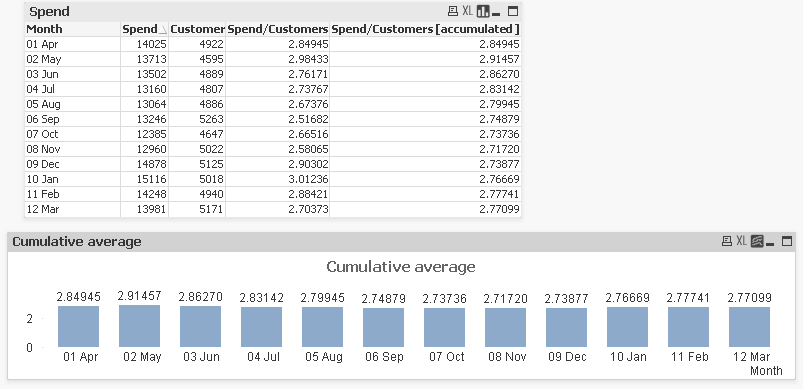
But I need to show the data in this visualization, but the result is different

This is the expression that I am using:
RangeSum(above(sum(CustomerSpend),0,rowno()))/RangeSum(above(sum([Customer Count]),0,rowno()))
I try to show the same information in both graphs, but when changing the type of table it is calculated different.
462 Views
1 Reply
Partner - Champion III
2018-07-16
07:01 PM
- Mark as New
- Bookmark
- Subscribe
- Mute
- Subscribe to RSS Feed
- Permalink
- Report Inappropriate Content
Above() might have to change to Before()....